Home Chemistry Report

Assignment #3: Inferential Statistics Analysis and Writeup Identifying

Course

Subject
Chemistry

Category
Report

Pages
9

Uploaded By
ATIPROS

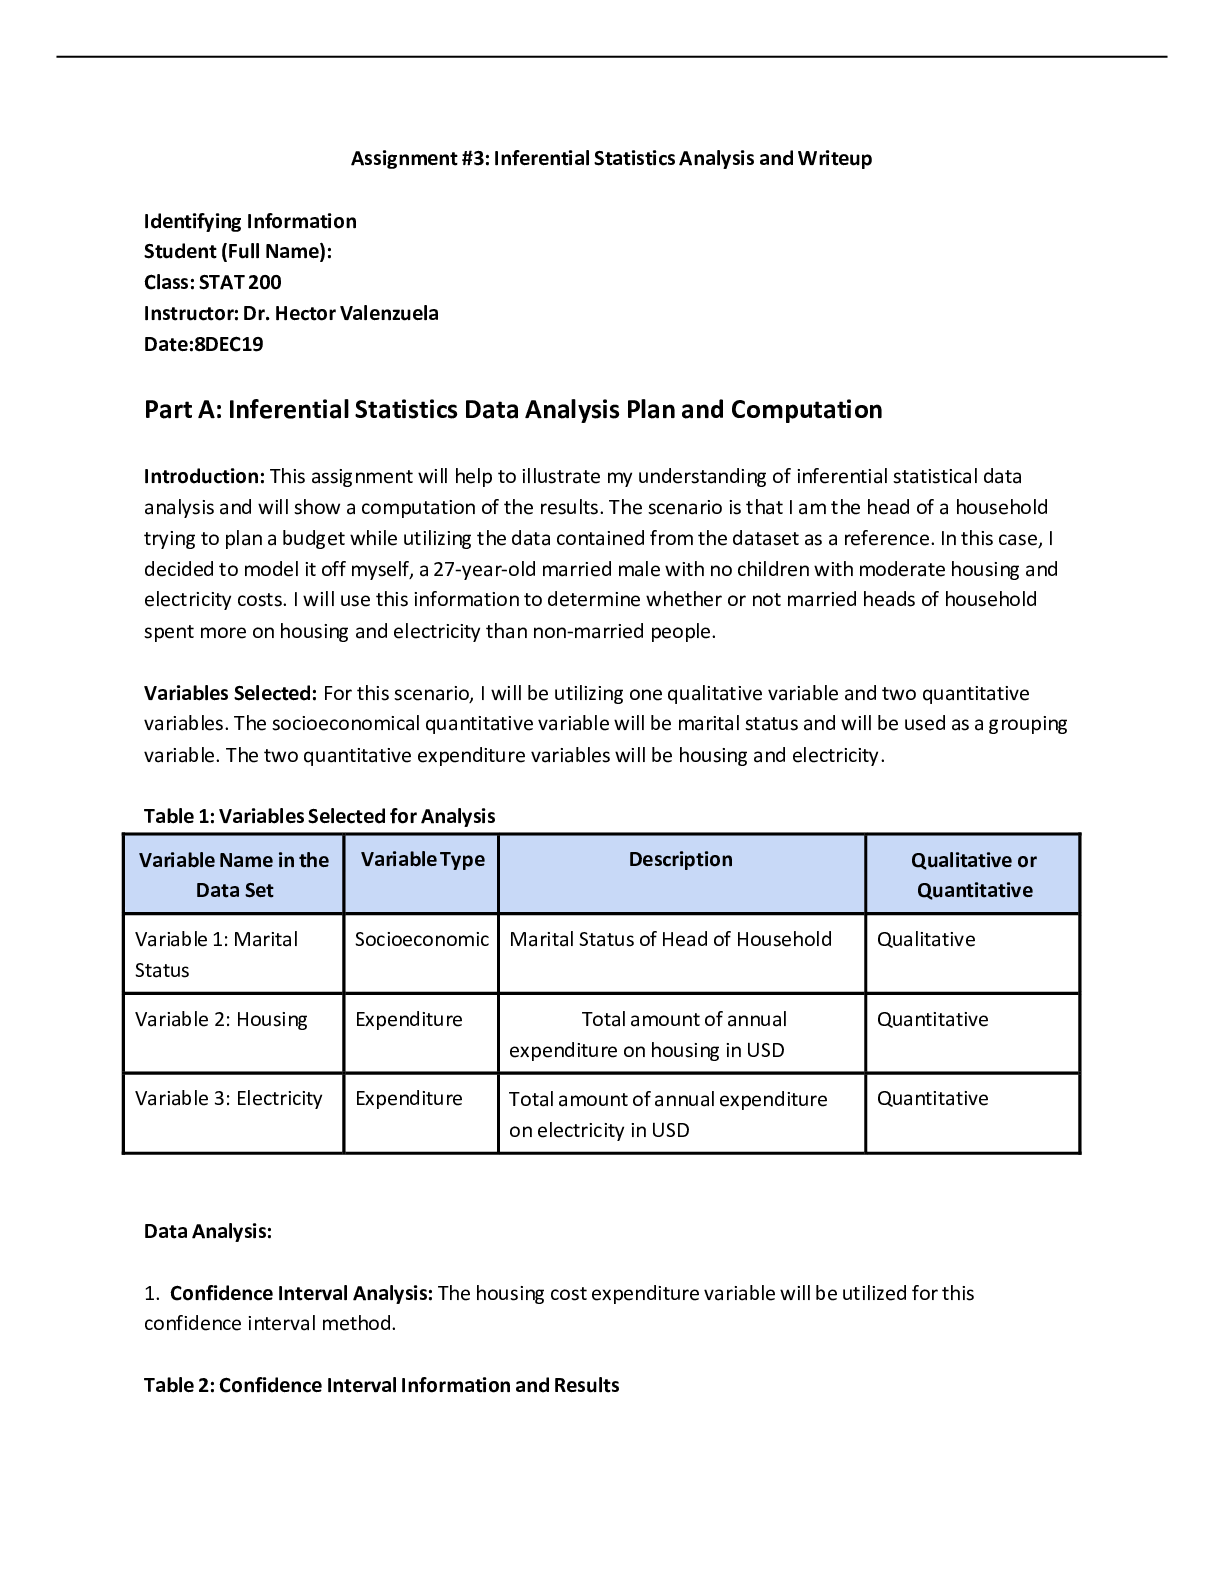
Identifying Information Student (Full Name): Class: STAT 200 Instructor: Dr. Hector Valenzuela Date:8DEC19 Part A: Inferential Statistics Data Analysis Plan and Computation Introduction: This assignment will help to illustrate my understanding of inferential statistical data analysis and will show a computation of the results. The scenario is that I am the head of a household trying to plan a budget while utilizing the data contained from the dataset as a reference. In this case, I decided to model it off myself, a 27-year-old married male with no children with moderate housing and electricity costs. I will use this information to determine whether or not married heads of household spent more on housing and electricity than non-married people. Variables Selected: For this scenario, I will be utilizing one qualitative variable and two quantitative variables. The socioeconomical quantitative variable will be marital status and will be used as a grouping variable. The two quantitative expenditure variables will be housing and electricity. Table 1: Variables Selected for Analysis Variable Name in the Data Set Variable Type Description Qualitative or Quantitative Variable 1: Marital Status Socioeconomic Marital Status of Head of Household Qualitative Variable 2: Housing Expenditure Total amount of annual expenditure on housing in USD Quantitative Variable 3: Electricity Expenditure Total amount of annual expenditure on electricity in USD Quantitative Data Analysis: 1. Confidence Interval Analysis: The housing cost expenditure variable will be utilized for this confidence interval method. Table 2: Confidence Interval Information and Results Name of Variable: Housing State the Random Variable and Parameterin Words: The random variables are the variables with values that have quantitative outcomes of the event. The basic parameters of random variables are mean, median, and standard deviation. There are more but these parameters are a great baseline. In the case of housing, it’s a variable that fluctuates greatly in relation to location, income levels, and relative cost of living. Confidence interval method including confidence level and rationale for using it: The confidence interval is the range of the values that are derived from the sample statistics provided, and it contains the total values of the unknown parameters. It is used because it is quantitative and gives a definite set of values for analysis. The confidence interval will be 95%. State and check the assumptionsfor confidence interval: A single confidence interval analysis was run for this test. Method Used to Analyze Data: I utilized Excel, MathIsFun calculator and Calculator.net for my methods and calculations. I run multiple calculators to compare results. The null hypothesis will prove that married people spent more on housing than non-married people. Find the sample statistic and the confidence interval: Based on the calculations made on the platforms listed above, I found that with a 95% confidence level, the sample mean would be between $20444.86 and $21684.86 based on the 30 samples. The standard of error is $1240 and standard deviation is $3463.397.
Read More

Preview 2 out of 9 Pages

Assignment__3__Inferential_Statistics_Analysis_and_Writeup.rtf.pdf prev1730986146672cc0a2bade8.png

Download all 9 pages for $ 10.50

Reviews (0)

$ 10.50


Seller

Joined: 6 months ago

Document sold: 0

Reviews received
1
0
0
0
0

Send Message
Document Information
Buy Document

$10.50