Home Chemistry Questions and Answers

DATA INTERPRETATION The pH scale is used

Course

Subject
Chemistry

Category
Questions and Answers

Pages
9

Uploaded By
ATIPROS

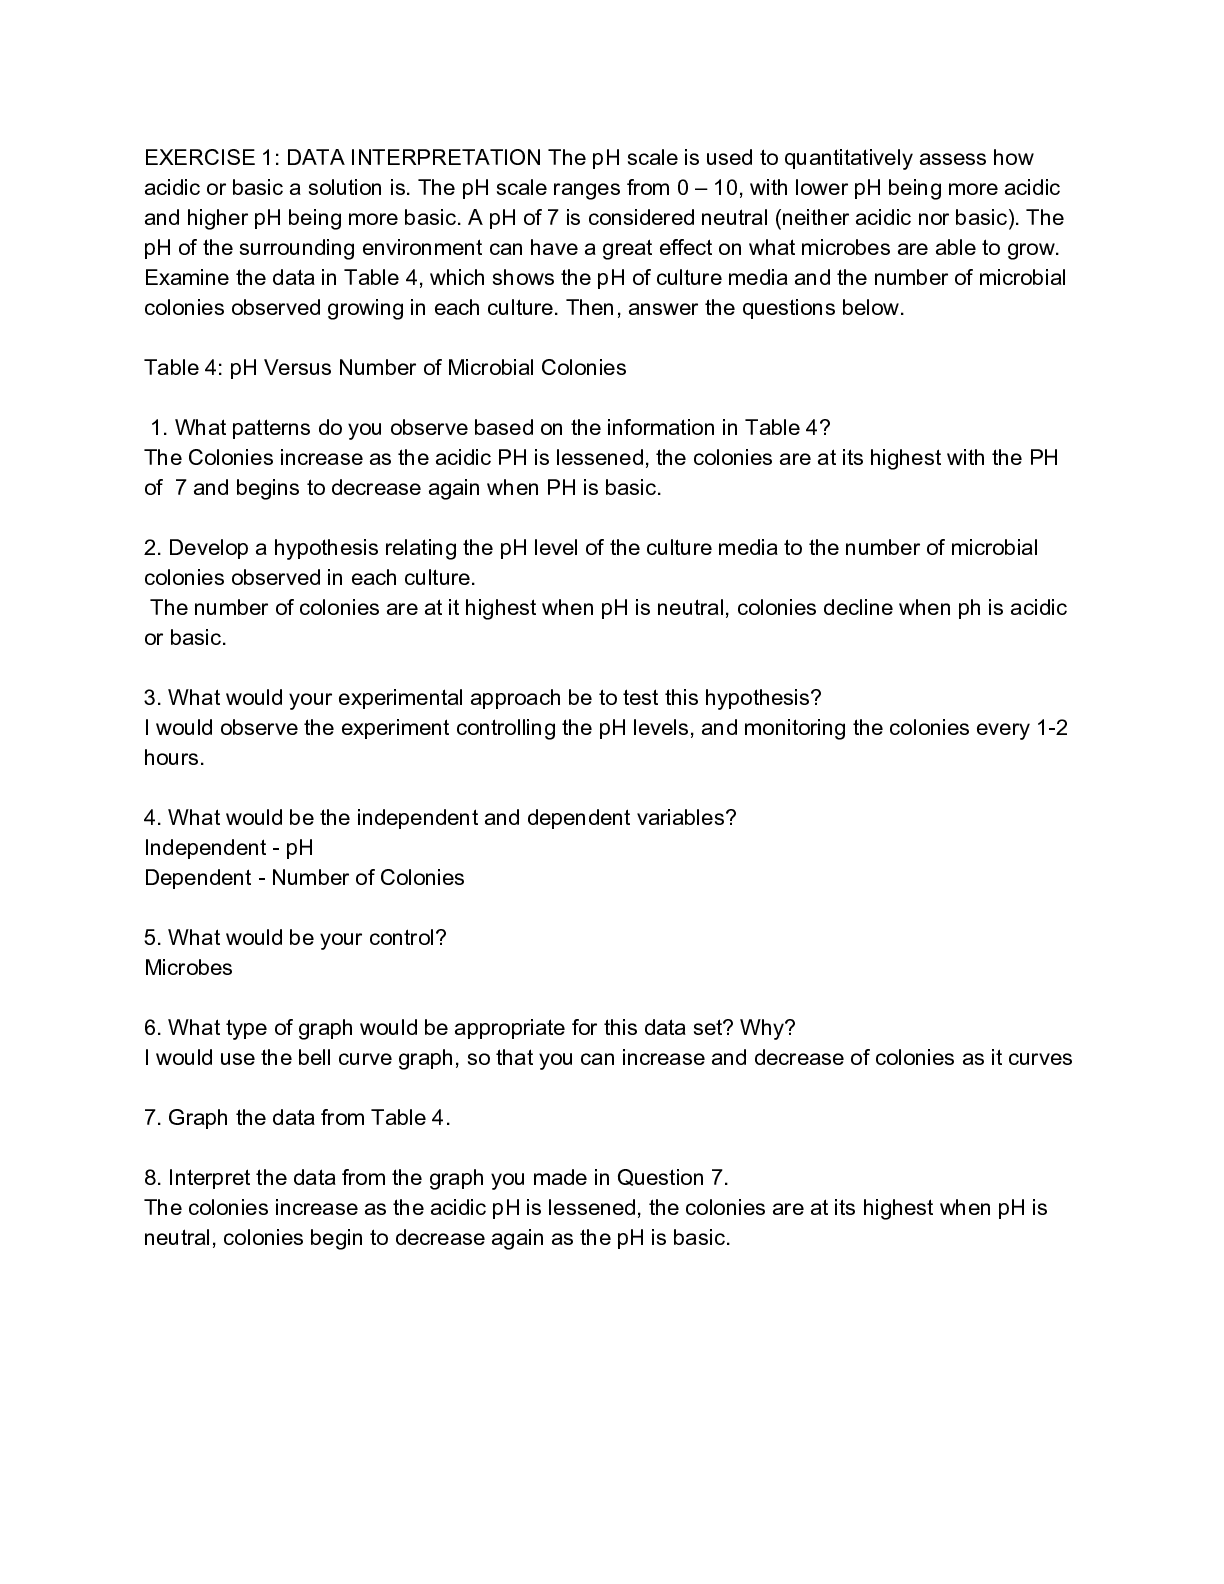
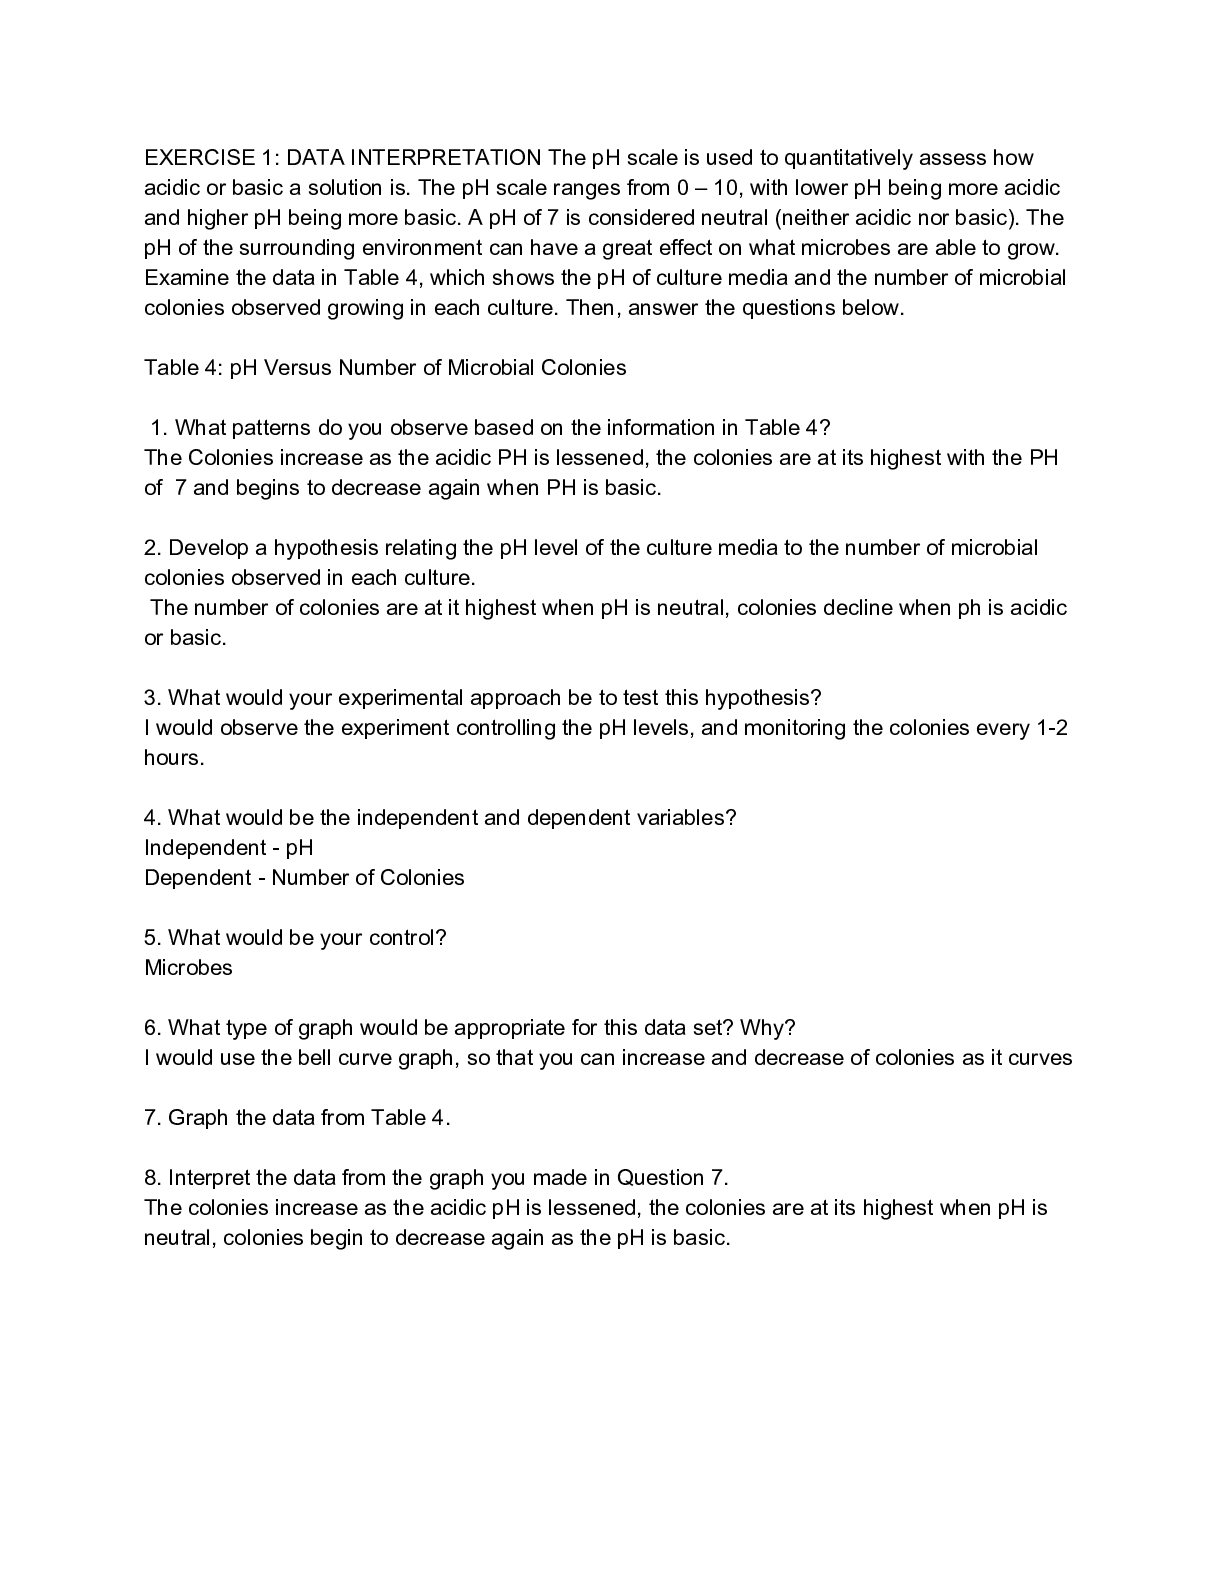
EXERCISE 1: DATA INTERPRETATION The pH scale is used to quantitatively assess how acidic or basic a solution is. The pH scale ranges from 0 – 10, with lower pH being more acidic and higher pH being more basic. A pH of 7 is considered neutral (neither acidic nor basic). The pH of the surrounding environment can have a great effect on what microbes are able to grow. Examine the data in Table 4, which shows the pH of culture media and the number of microbial colonies observed growing in each culture. Then, answer the questions below. Table 4: pH Versus Number of Microbial Colonies 1. What patterns do you observe based on the information in Table 4? The Colonies increase as the acidic PH is lessened, the colonies are at its highest with the PH of 7 and begins to decrease again when PH is basic. 2. Develop a hypothesis relating the pH level of the culture media to the number of microbial colonies observed in each culture. The number of colonies are at it highest when pH is neutral, colonies decline when ph is acidic or basic. 3. What would your experimental approach be to test this hypothesis? I would observe the experiment controlling the pH levels, and monitoring the colonies every 1-2 hours. 4. What would be the independent and dependent variables? Independent - pH Dependent - Number of Colonies 5. What would be your control? Microbes 6. What type of graph would be appropriate for this data set? Why? I would use the bell curve graph, so that you can increase and decrease of colonies as it curves 7. Graph the data from Table 4. 8. Interpret the data from the graph you made in Question 7. The colonies increase as the acidic pH is lessened, the colonies are at its highest when pH is neutral, colonies begin to decrease again as the pH is basic. EXERCISE 2: TESTABLE OBSERVATIONS Below are several observations that can inform a testable hypothesis. For each of the following observations: • Determine if the observation is qualitative or quantitative. • Write a hypothesis and a null hypothesis. • What would be your experimental approach? • What are the dependent and independent variables? • What are your controls - both positive and negative? • How will you collect your data? • How will you present your data (e.g., chart, graph)?
Read More

Preview 1 out of 9 Pages

_Exercise_1_4_and_Experiment_1.pdf.pdf

Download all 9 pages for $ 6.50

Reviews (0)

$ 6.50


Seller

Joined: 6 months ago

Document sold: 0

Reviews received
1
0
0
0
0

Send Message
Document Information
Buy Document

$6.50