Home Chemistry Questions and Answers

Final Exam Question 1

Course

Subject
Chemistry

Category
Questions and Answers

Pages
8

Uploaded By
ATIPROS

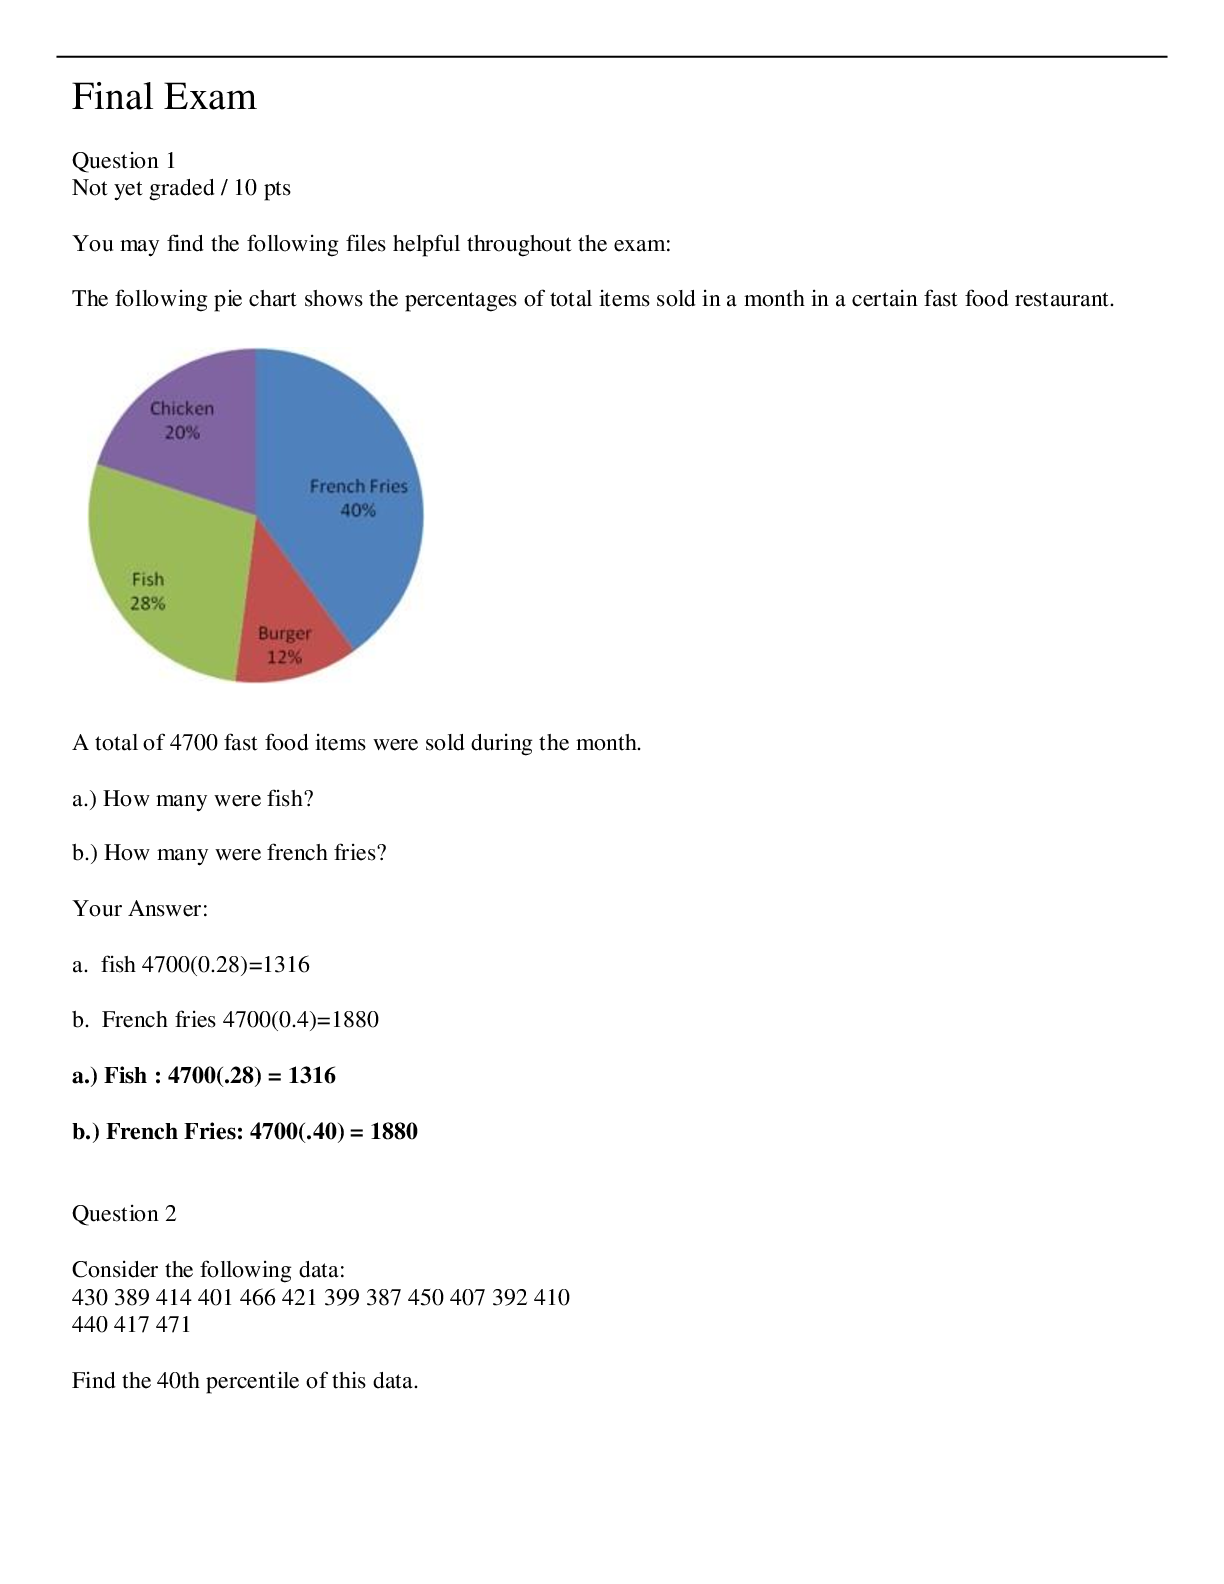
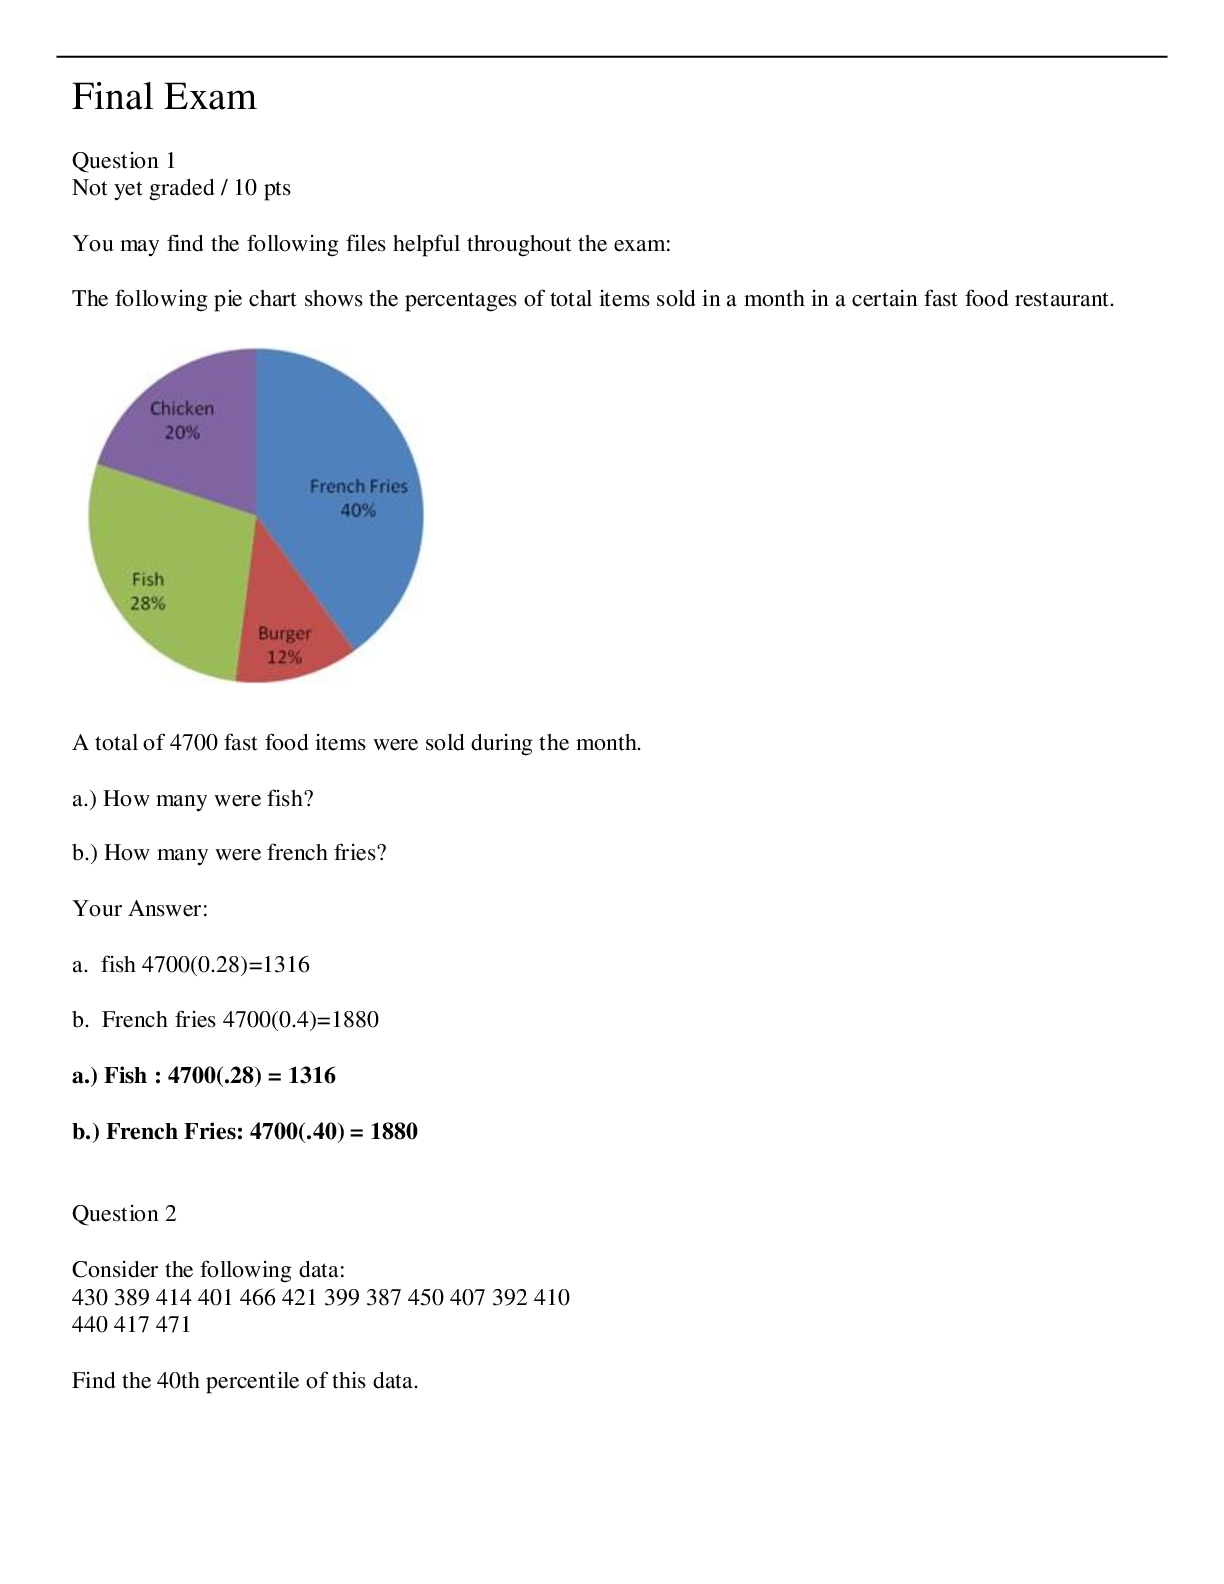
Final Exam Question 1 Not yet graded / 10 pts You may find the following files helpful throughout the exam: The following pie chart shows the percentages of total items sold in a month in a certain fast food restaurant. A total of 4700 fast food items were sold during the month. a.) How many were fish? b.) How many were french fries? Your Answer: a. fish 4700(0.28)=1316 b. French fries 4700(0.4)=1880 a.) Fish : 4700(.28) = 1316 b.) French Fries: 4700(.40) = 1880 Question 2 Consider the following data: 430 389 414 401 466 421 399 387 450 407 392 410 440 417 471 Find the 40th percentile of this data. There are a total of fifteen numbers, so n= 15. In order to find the percentiles, we must put the numbers in ascending order: 387 389 392 399 401 407 410 414 417 421 430 440 450 466 471 For the 40th percentile: Therefore, the 40th percentile index for this data set is the 6th observation. In the list above, the 6th observation is 407. Question 3
Read More

Preview 2 out of 8 Pages

final_Exam.pdf.pdf prev1730986215672cc0e7d1a40.png

Download all 8 pages for $ 7.50

Reviews (0)

$ 7.50


Seller

Joined: 7 months ago

Document sold: 0

Reviews received
1
0
0
0
0

Send Message
Document Information
Buy Document

$7.50