Home Chemistry Questions and Answers

Introduction to Statistics Unit 2 Data Representation and Distributions

Course

Subject
Chemistry

Category
Questions and Answers

Pages
15

Uploaded By
ATIPROS

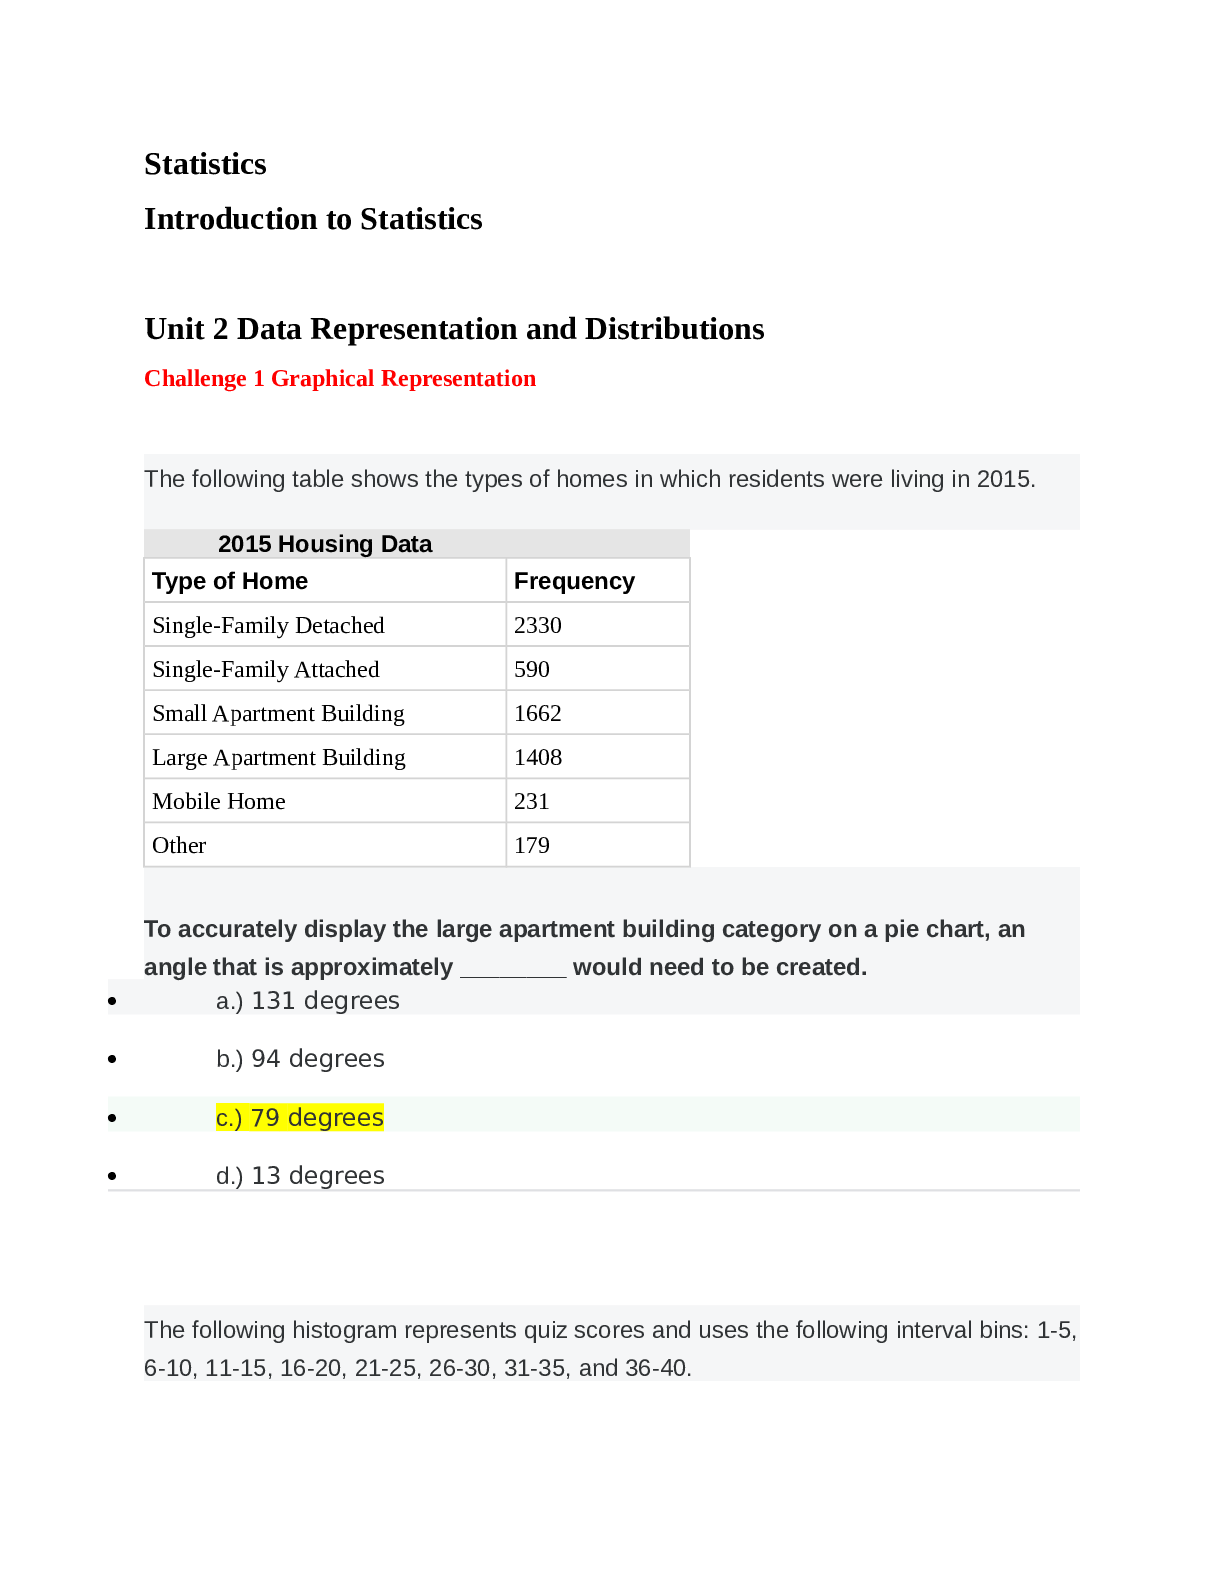
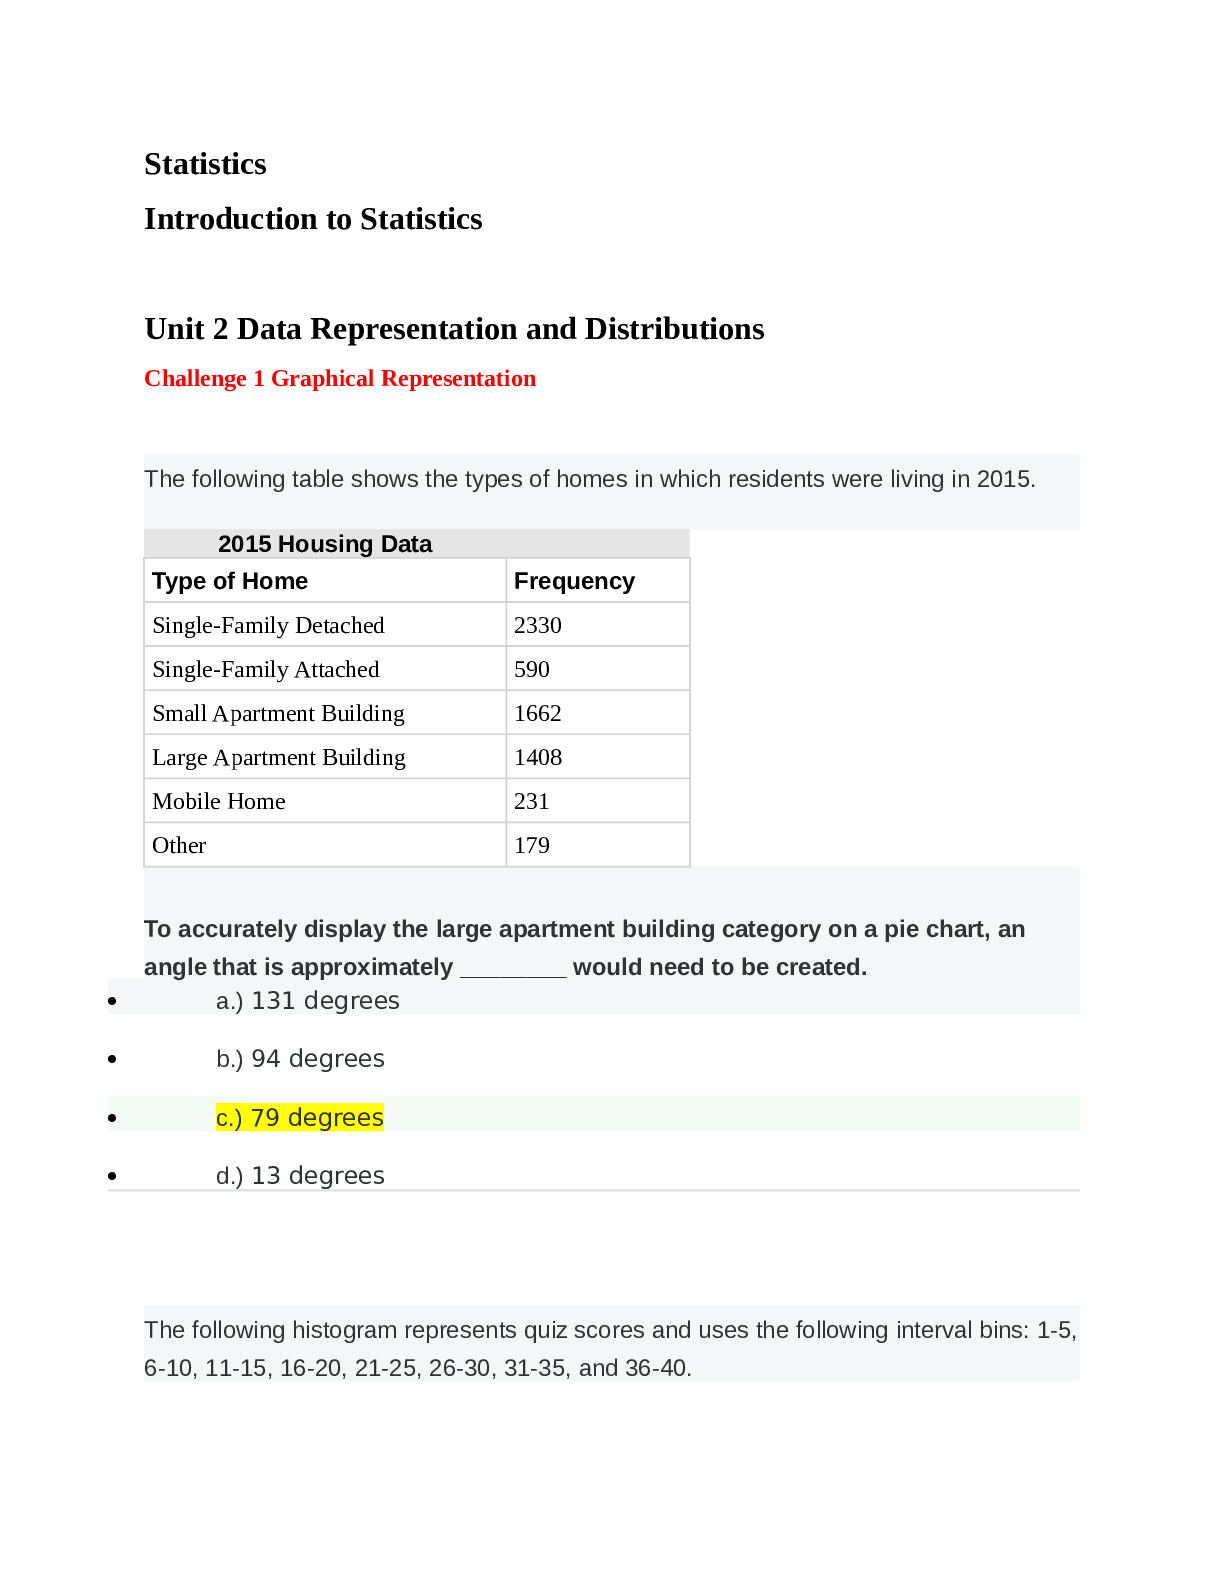
Challenge 1 Graphical Representation The following table shows the types of homes in which residents were living in 2015. 2015 Housing Data Type of Home Frequency Single-Family Detached 2330 Single-Family Attached 590 Small Apartment Building 1662 Large Apartment Building 1408 Mobile Home 231 Other 179     To accurately display the large apartment building category on a pie chart, an angle that is approximately ________ would need to be created. a.) 131 degrees b.) 94 degrees c.) 79 degrees d.) 13 degrees The following histogram represents quiz scores and uses the following interval bins: 1-5, 6-10, 11-15, 16-20, 21-25, 26-30, 31-35, and 36-40.
Read More

Preview 1 out of 15 Pages

Unit_2_Data_Representation_and_Distributions.docx.pdf

Download all 15 pages for $ 8.00

Reviews (0)

$ 8.00


Seller

Joined: 6 months ago

Document sold: 0

Reviews received
1
0
0
0
0

Send Message
Document Information
Buy Document

$8.00