Home Chemistry Questions and Answers

MATH 201 Week 2 Exercise answers

Course
Sociology

Subject
Chemistry

Category
Questions and Answers

Pages
10

Uploaded By
ATIPROS

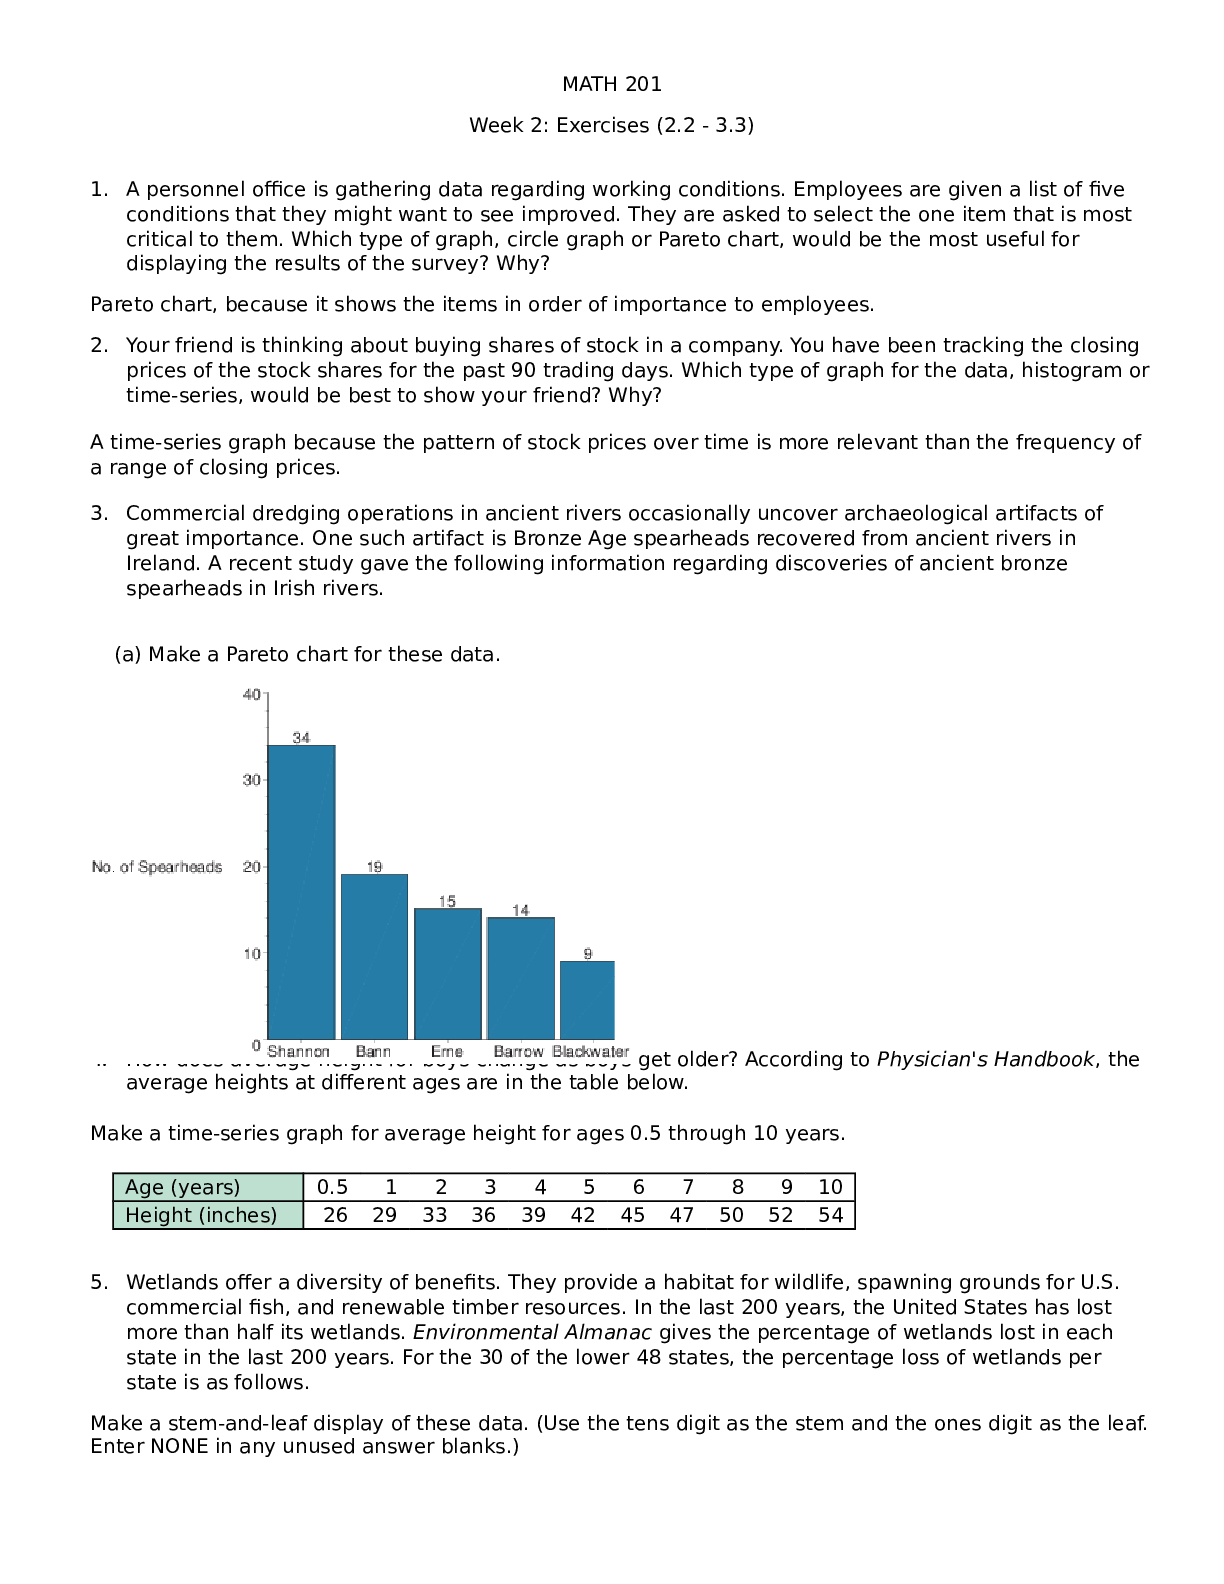
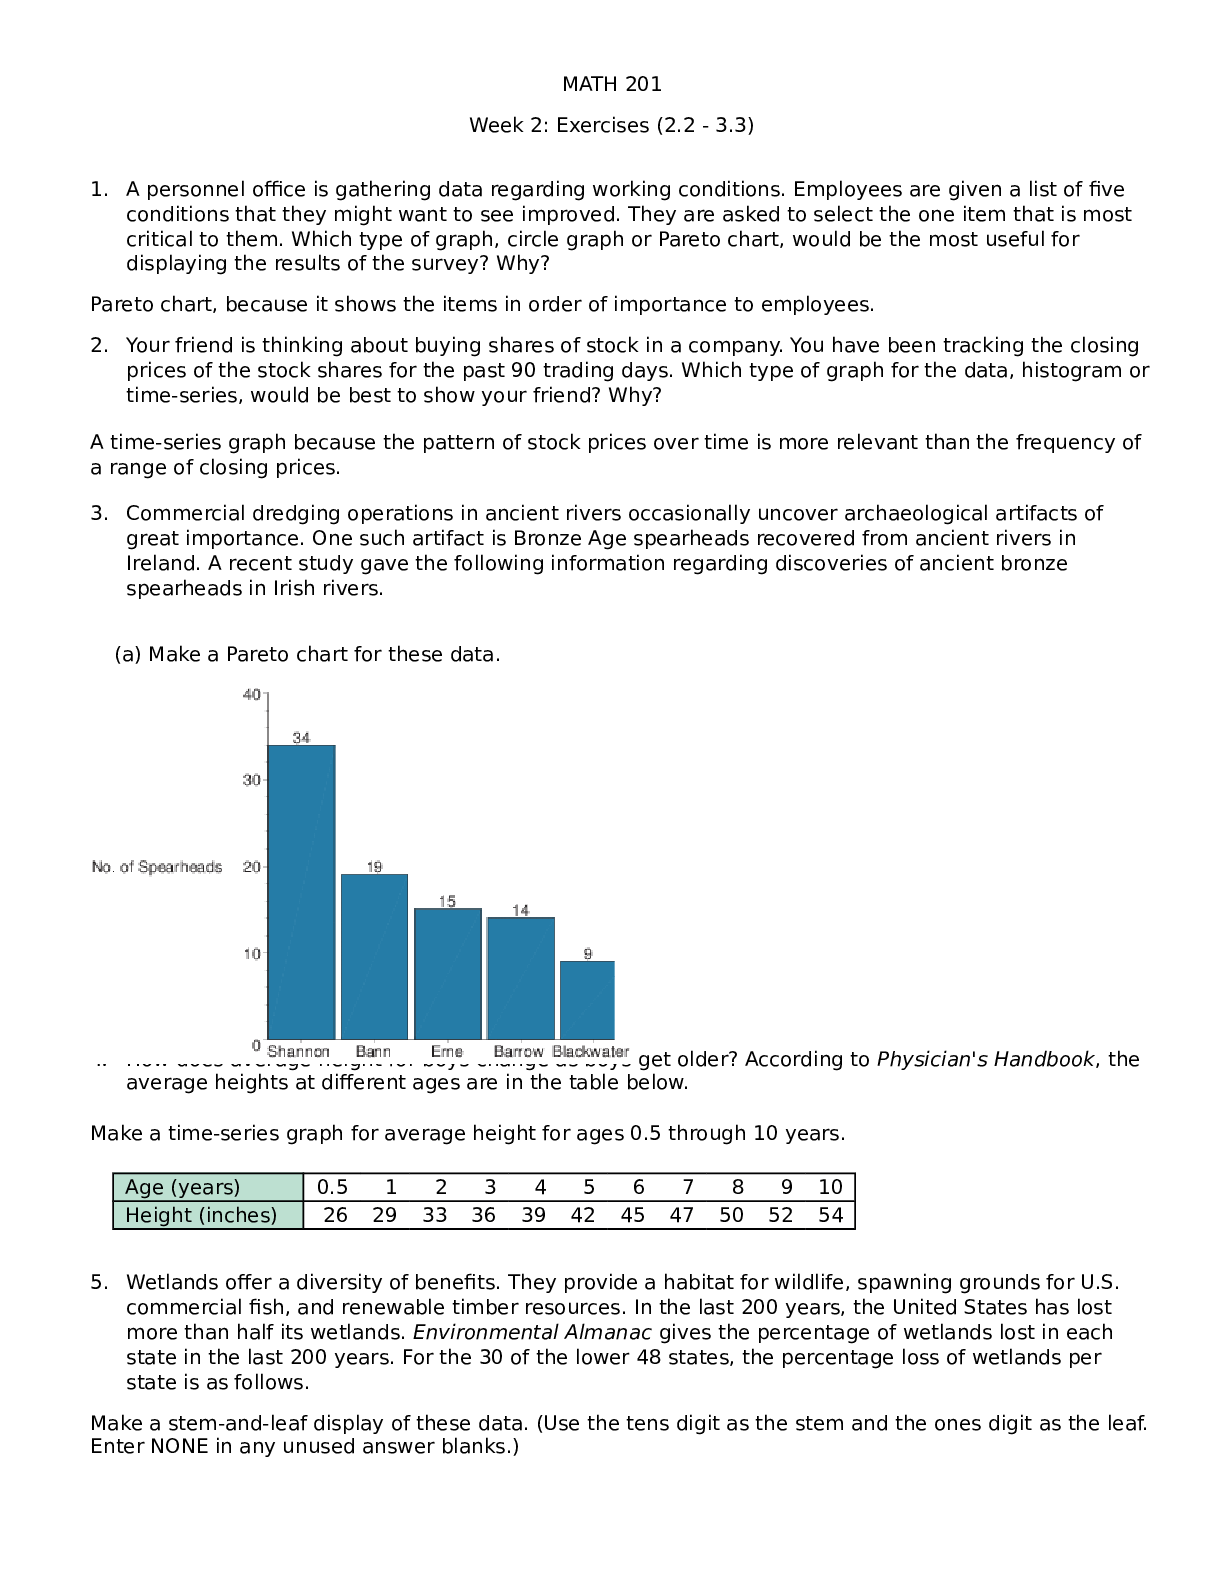
MATH 201 Week 2: Exercises (2.2 - 3.3) 1.A personnel office is gathering data regarding working conditions. Employees are given a list of five conditions that they might want to see improved. They are asked to select the one item that is most critical to them. Which type of graph, circle graph or Pareto chart, would be the most useful for displaying the results of the survey? Why? Pareto chart, because it shows the items in order of importance to employees. 2.Your friend is thinking about buying shares of stock in a company. You have been tracking the closing prices of the stock shares for the past 90 trading days. Which type of graph for the data, histogram or time-series, would be best to show your friend? Why? A time-series graph because the pattern of stock prices over time is more relevant than the frequency of a range of closing prices. 3.Commercial dredging operations in ancient rivers occasionally uncover archaeological artifacts of great importance. One such artifact is Bronze Age spearheads recovered from ancient rivers in Ireland. A recent study gave the following information regarding discoveries of ancient bronze spearheads in Irish rivers. (a) Make a Pareto chart for these data. 4. How does average height for boys change as boys get older? According to Physician's Handbook, the average heights at different ages are in the table below. Make a time-series graph for average height for ages 0.5 through 10 years. Age (years) 0.5 1 2 3 4 5 6 7 8 9 10 Height (inches) 26 29 33 36 39 42 45 47 50 52 54 5.Wetlands offer a diversity of benefits. They provide a habitat for wildlife, spawning grounds for U.S. commercial fish, and renewable timber resources. In the last 200 years, the United States has lost more than half its wetlands. Environmental Almanac gives the percentage of wetlands lost in each state in the last 200 years. For the 30 of the lower 48 states, the percentage loss of wetlands per state is as follows. Make a stem-and-leaf display of these data. (Use the tens digit as the stem and the ones digit as the leaf. Enter NONE in any unused answer blanks.)
Read More

Preview 2 out of 10 Pages

MATH_201_Week_2_Exercise.docx.pdf prev1730998956672cf2acd3de5.png

Download all 10 pages for $ 7.50

Reviews (0)

$ 7.50


Seller

Joined: 7 months ago

Document sold: 0

Reviews received
1
0
0
0
0

Send Message
Document Information
Buy Document

$7.50