Home Chemistry Questions and Answers

Module_2_Homework

Course
Project Management

Subject
Chemistry

Category
Questions and Answers

Pages
23

Uploaded By
ATIPROS

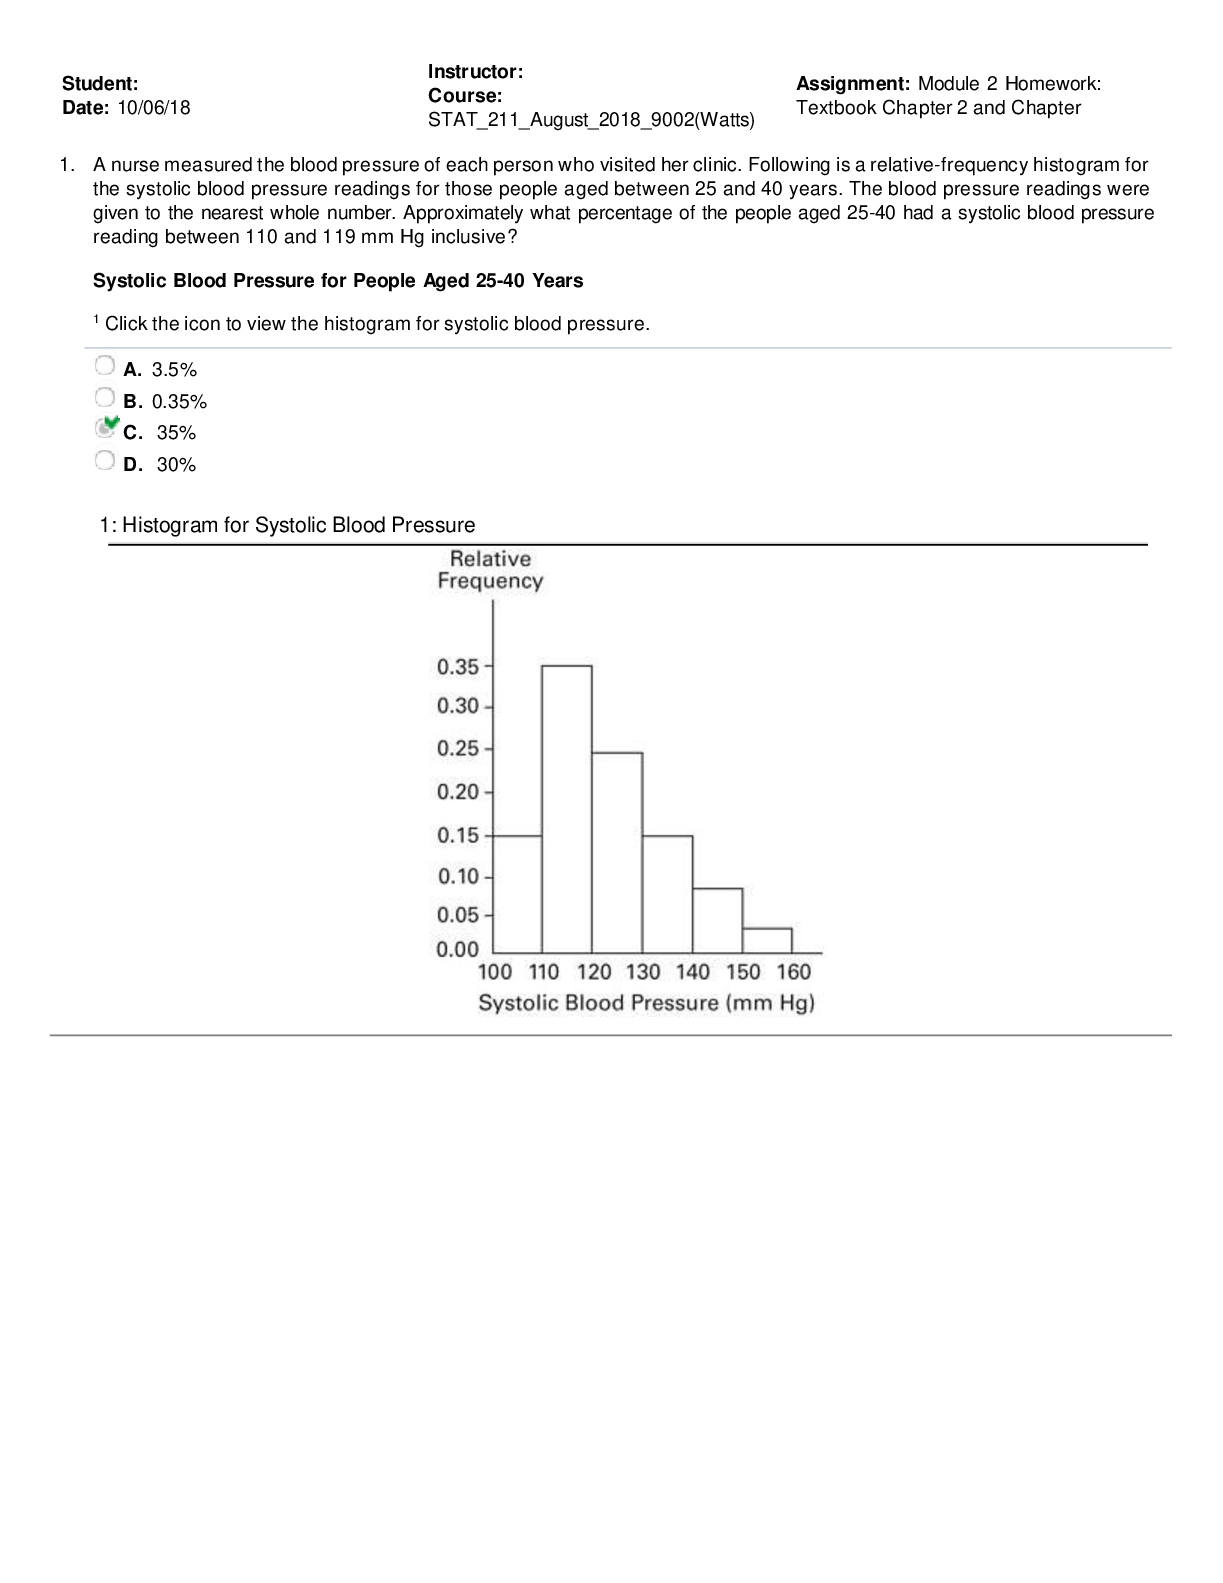
Student: Date: 10/06/18 Instructor: Course: STAT_211_August_2018_9002(Watts) Assignment: Module 2 Homework: Textbook Chapter 2 and Chapter 1. A nurse measured the blood pressure of each person who visited her clinic. Following is a relative-frequency histogram for the systolic blood pressure readings for those people aged between 25 and 40 years. The blood pressure readings were given to the nearest whole number. Approximately what percentage of the people aged 25-40 had a systolic blood pressure reading between 110 and 119 mm Hg inclusive? Systolic Blood Pressure for People Aged 25-40 Years 1 Click the icon to view the histogram for systolic blood pressure. A. 3.5% B. 0.35% C. 35% D. 30% 1: Histogram for Systolic Blood Pressure 2. The histogram below represents the number of television sets per household for a sample of U.S. households. What is the sample size? Number of Television Sets Per U.S. Household 2 Click the icon to view the histogram for the number of television sets per U.S. household. A. 90 households B. 100 households C. 5 households D. 50 households 2: Histogram for Number of Television Sets per U.S. Household 3. Smoking and the episodes of lung cancer have a high correlation, but it does not prove . A. causation B. exponentiation C. a linear relationship D. correlation 4. The scatterplot below displays the amount of nitrous oxide (NO) explained by the amount of carbon monoxide (CO) emissions in million metric tons over a ten year period in the United States. Select the choice that best describes any relationship between the variables. 3 Click the icon to view the scatterplot. A. Overall, there is no noticeable relationship between NO and CO. B. There is a positive linear association between NO and CO. C. There is a negative linear association between NO and CO. D. NO can be explained by CO. 3: Scatterplot 5. Which of these choices display the correct scatterplot for the data? A. B. C. D. x 0.51 0.02 0.14 0.29 0.34 0.8 0.47 0.71 y 0.31 0.46 − 0.12 0.34 − 0.05 0.8 0.35 0.47 6. Refer to the table summarizing service times (seconds) of dinners at a fast food restaurant. How many individuals are included in the summary? Is it possible to identify the exact values of all of the original service times? 52 individuals are included in the summary. (Type a whole number.) Is it possible to identify the exact values of all of the original service times? A. Yes. The data values in each class are spread evenly across the full length of the class. B. No. The frequency distribution tells nothing about the data values that fall below the lowest class limit or above the highest class limit. C. Yes. The data values in each class are equal to the corresponding class midpoint. D. No. The data values in each class could take on any value between the class limits, inclusive. 7. A frequency table of grades has five classes (A, B, C, D, F) with frequencies of 4, 15, 16, 6, and 1 percentages, what are the relative frequencies of the five classes? respectively. Using Complete the table. Grade Frequency Relative frequency
Read More

Preview 5 out of 23 Pages

Module_2_Homework__Textbook_Chapter_2_and_Chapter (1).pdf prev1730984952672cbbf85f1a5.png

Download all 23 pages for $ 12.00

Reviews (0)

$ 12.00


Seller

Joined: 7 months ago

Document sold: 0

Reviews received
1
0
0
0
0

Send Message
Document Information
Buy Document

$12.00