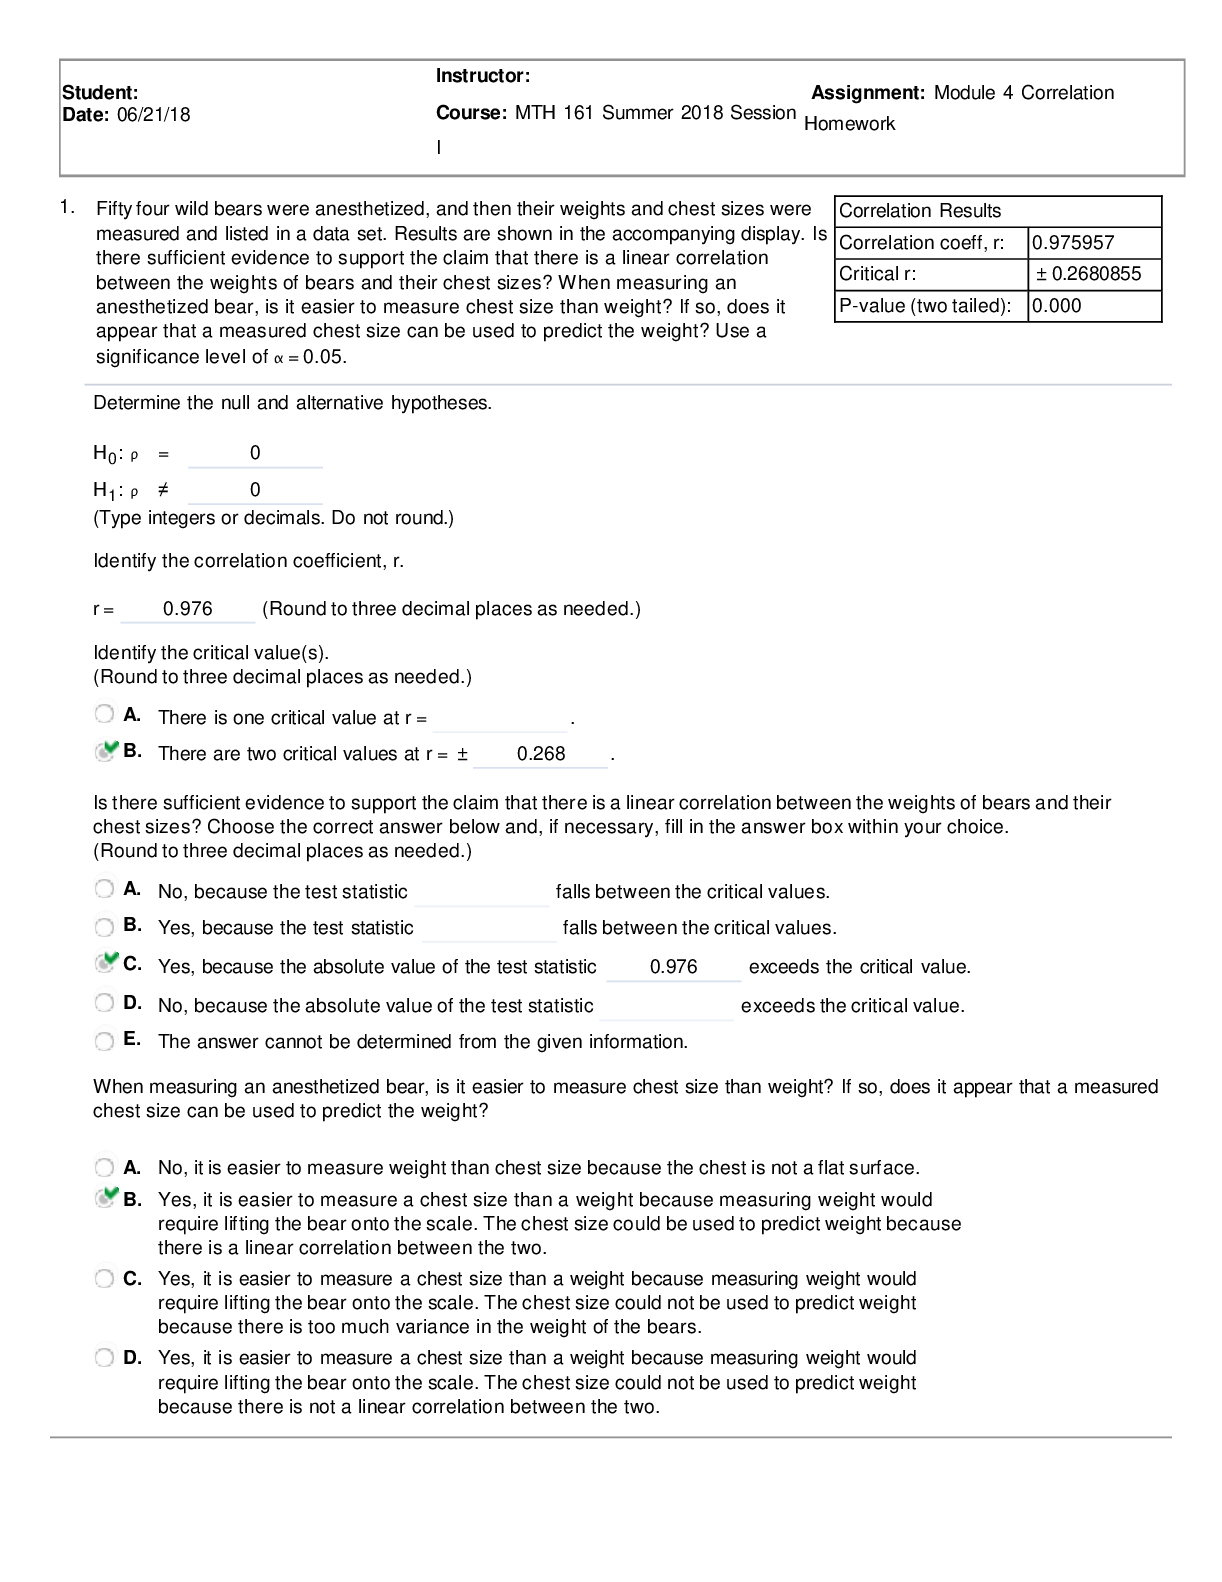
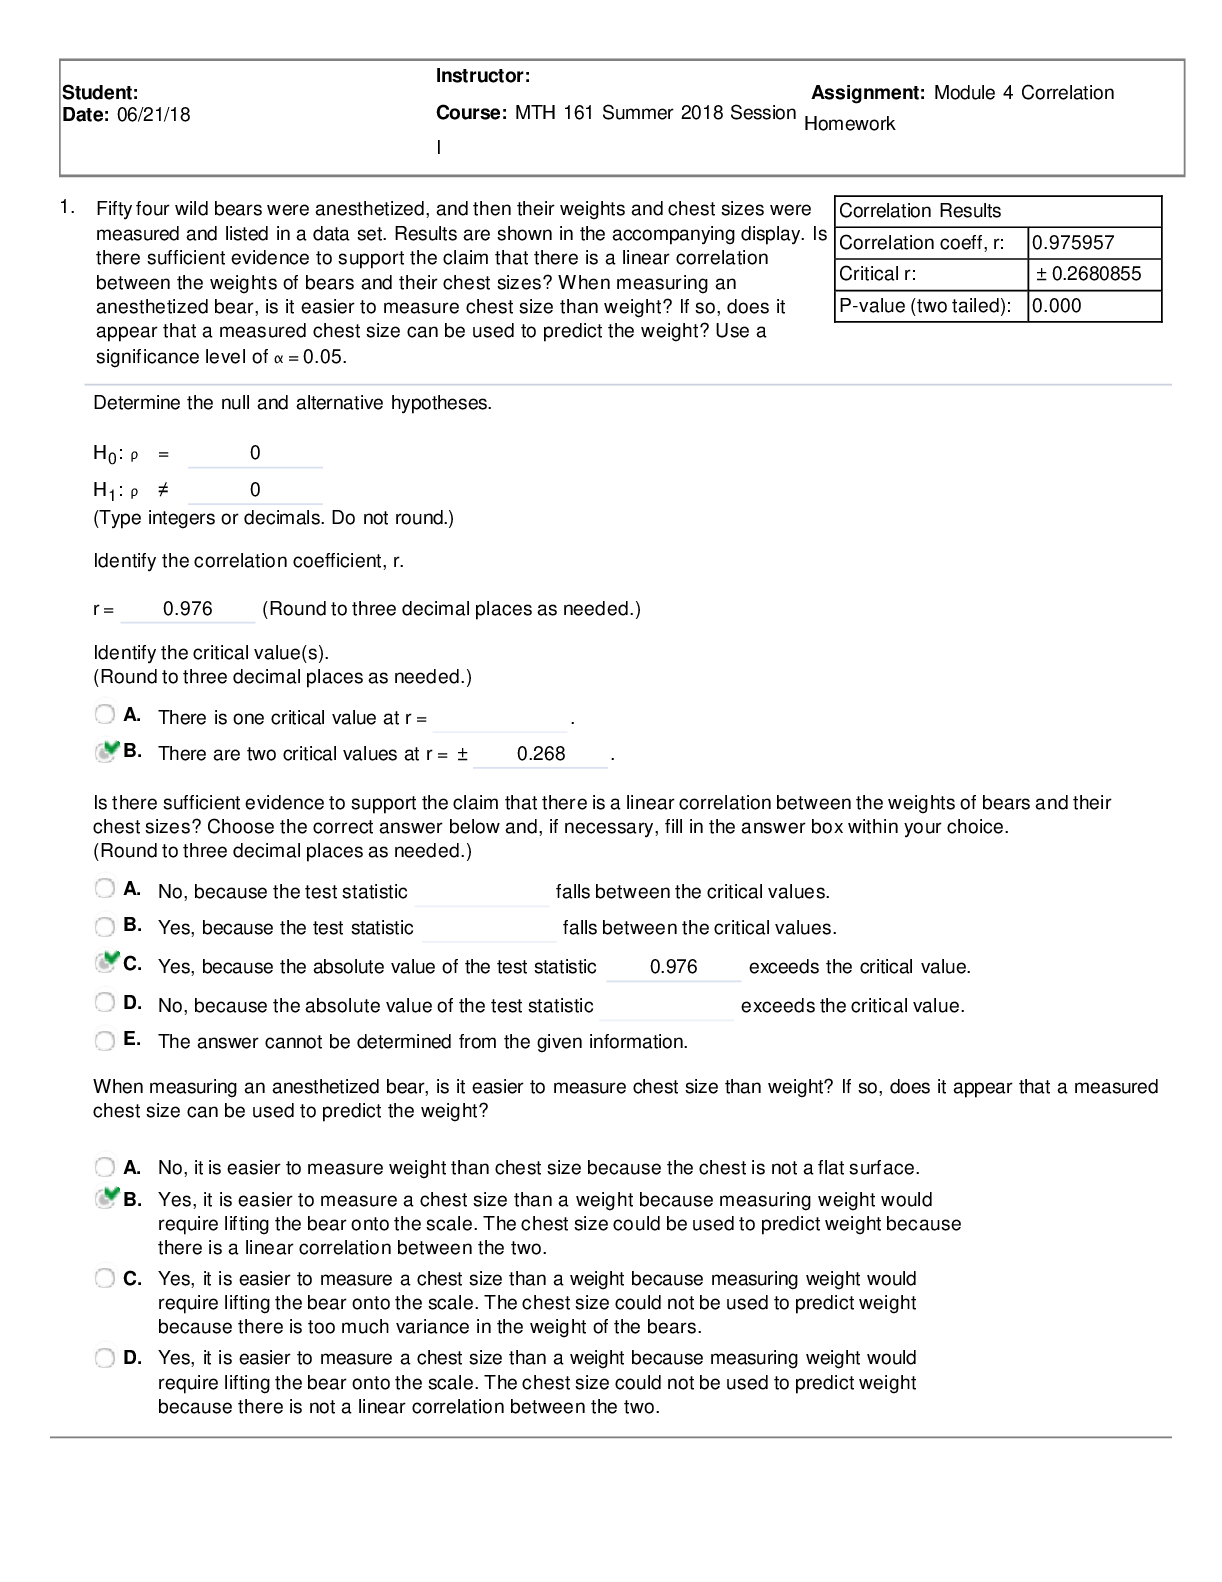
1. Fifty-four wild bears were anesthetized, and then their weights and chest sizes were
measured and listed in a data set. Results are shown in the accompanying display. Isthere sufficient evidence to support the claim that there is a linear correlationbetween the weights of bears and their chest sizes? When measuring ananesthetized bear, is it easier to measure chest size than weight? If so, does itappear that a measured chest size can be used to predict the weight? Use asignificance level of α = 0.05.Determine the null and alternative hypotheses.H0: ρ = 0 H1: ρ ≠ 0(Type integers or decimals. Do not round.)Identify the correlation coefficient, r.r = 0.976 (Round to three decimal places as needed.)Identify the critical value(s).(Round to three decimal places as needed.)A. There is one critical value at r = .B. There are two critical values at r = ± 0.268 .Is there sufficient evidence to support the claim that there is a linear correlation between the weights of bears and theirchest sizes? Choose the correct answer below and, if necessary, fill in the answer box within your choice.(Round to three decimal places as needed.)A. No, because the test statistic falls between the critical values.B. Yes, because the test statistic falls between the critical values.C. Yes, because the absolute value of the test statistic 0.976 exceeds the critical value.D. No, because the absolute value of the test statistic exceeds the critical value.E. The answer cannot be determined from the given information.When measuring an anesthetized bear, is it easier to measure chest size than weight? If so, does it appear that a measuredchest size can be used to predict the weight?A. No, it is easier to measure weight than chest size because the chest is not a flat surface.B. Yes, it is easier to measure a chest size than a weight because measuring weight wouldrequire lifting the bear onto the scale. The chest size could be used to predict weight becausethere is a linear correlation between the two.C. Yes, it is easier to measure a chest size than a weight because measuring weight wouldrequire lifting the bear onto the scale. The chest size could not be used to predict weightbecause there is too much variance in the weight of the bears.D. Yes, it is easier to measure a chest size than a weight because measuring weight wouldrequire lifting the bear onto the scale. The chest size could not be used to predict weightbecause there is not a linear correlation between the two.Student:Date: 06/21/18Instructor:Course: MTH 161 Summer 2018 Session Homework
Assignment: Module 4 CorrelationICorrelation ResultsCorrelation coeff, r: 0.975957Critical r: ± 0.2680855P-value (two tailed): 0.0002. A data set includes weights of garbage discarded in one week from 62 different households. Thepaired weights of paper and glass were used to obtain the results shown to the right. Is theresufficient evidence to support the claim that there is a linear correlation between weights ofdiscarded paper and glass? Use a significance level of α = 0.05.Click here to view a table of critical values for the correlation coefficient.1Determine the null and alternative hypotheses.H0: ρ = 0 H1: ρ ≠ 0(Type integers or decimals. Do not round.)Identify the test statistic, r.r = 0.355 (Round to three decimal places as needed.)Identify the critical value(s).(Round to three decimal places as needed.)A. There are two critical values at r = ± 0.250 .B. There is one critical value at r = .State the conclusion.Because the absolute value of the test statistic is greater than the positive critical value, there is sufficientevidence to support the claim that there is a linear correlation between the weights of discarded paper and glass for asignificance level of α = 0.05.1: Table of Critical ValuesCorrelation matrix:Variables Paper GlassPaper 1 0.3549Glass 0.3549 13. Listed below are numbers of Internet users per 100 people and numbers of scientific award winners per 10 million peoplefor different countries. Construct a scatterplot, find the value of the linear correlation coefficient r, and find the P-value of r.Determine whether there is sufficient evidence to support a claim of linear correlation between the two variables. Use asignificance level of α = 0.01.Internet Users 78.2 80.8 56.1 68.7 77.1 37.9Award Winners 5.5 9.4 3.3 1.7 11.1 0.1Construct a scatterplot. Choose the correct graph below.A. B. C. D.12 12 12 12030 90Internet Users030 90Internet Users030 90Internet Users030 90Internet UsersThe linear correlation coefficient r is 0.785 .(Round to three decimal places as needed.)Determine the null and alternative hypotheses.H0: ρ = 0 H1: ρ ≠ 0(Type integers or decimals. Do not round.)The test statistic i2.54 .(Round to two decimal places as needed.)The P-value is 0.064 .(Round to three decimal places as needed.)Because the P-value of the linear correlation coefficient is greater than the significance level, thereis not sufficient evidence to support the claim that there is a linear correlation between Internet users and scientific awardwinners. Award WinnersAward WinnersAward WinnersAward Winners
Read More


