Home Chemistry Questions Only

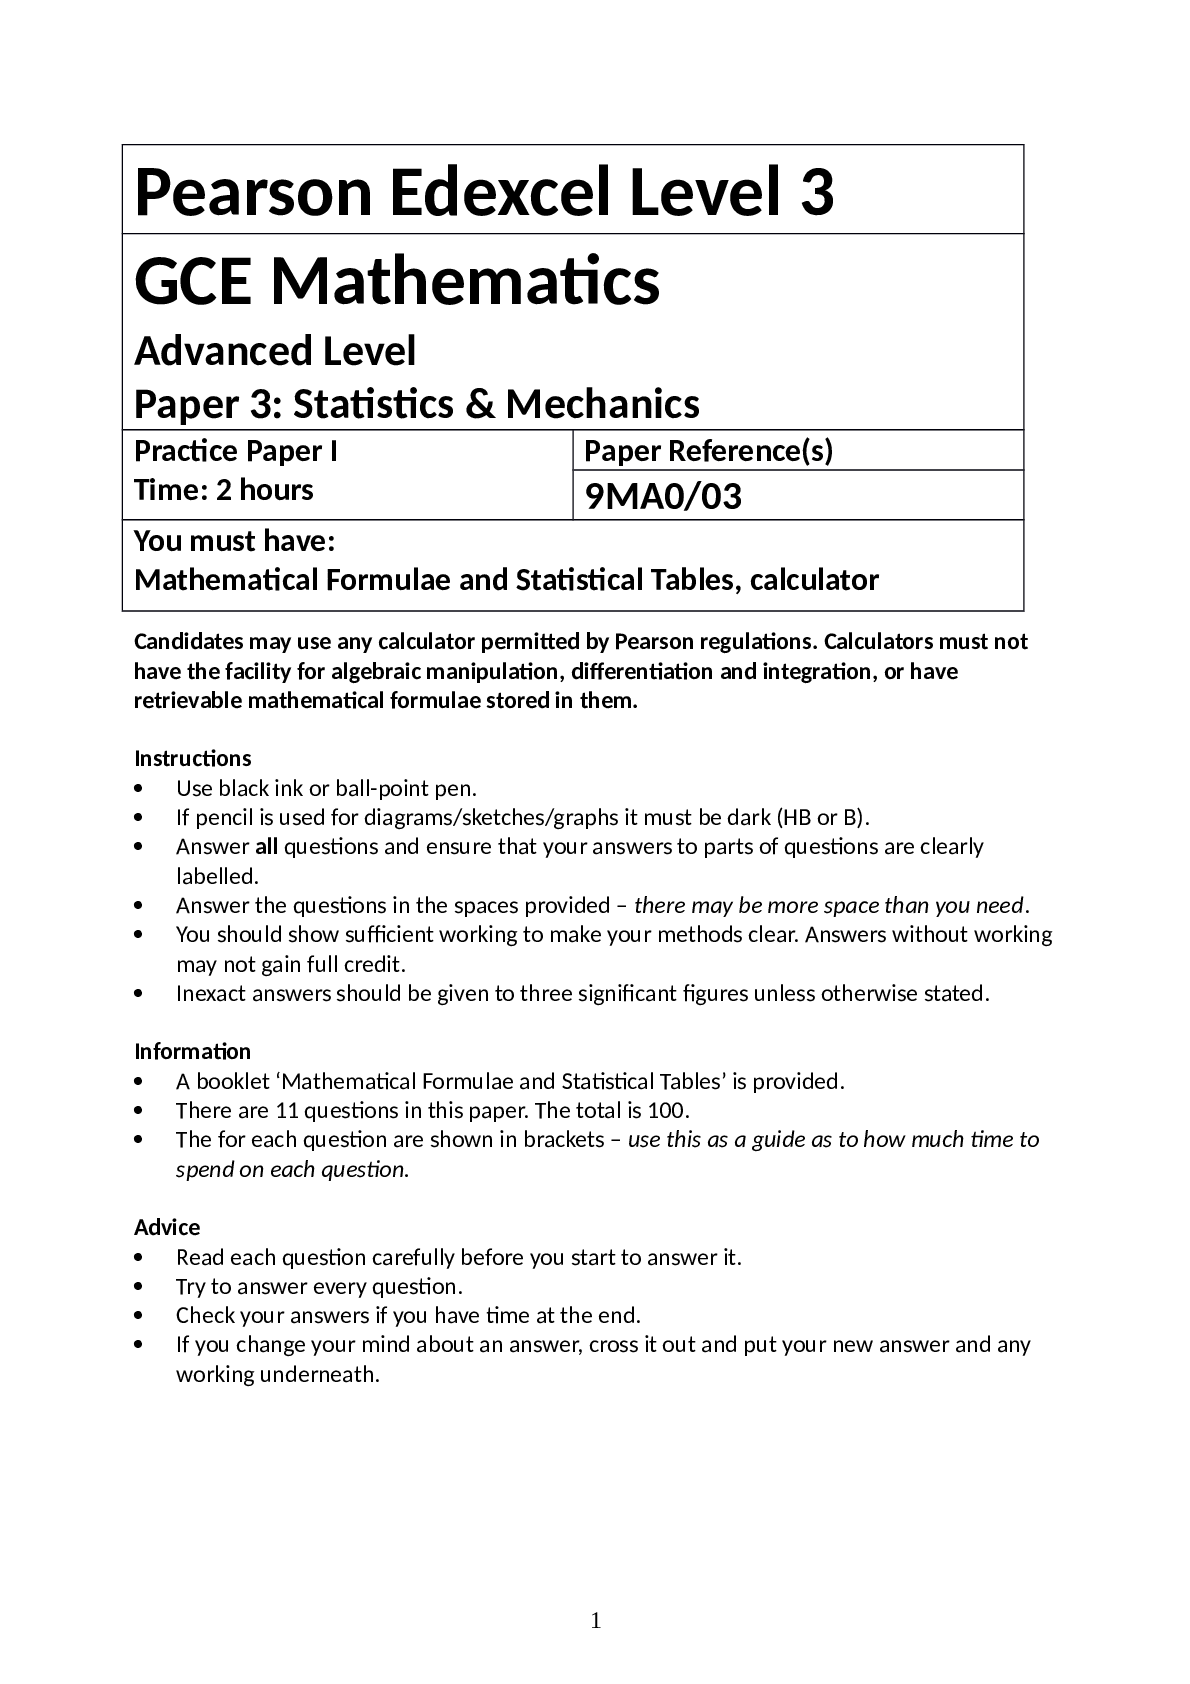
Pearson Edexcel Level 3 GCE Mathematics Advanced Level Paper 3: Statistics & Mechanics

Course
Sociology

Subject
Chemistry

Category
Questions Only

Pages
12

Uploaded By
ATIPROS

Candidates may use any calculator permitted by Pearson regulations. Calculators must not have the facility for algebraic manipulation, differentiation and integration, or have retrievable mathematical formulae stored in them. Instructions  Use black ink or ball-point pen.  If pencil is used for diagrams/sketches/graphs it must be dark (HB or B).  Answer all questions and ensure that your answers to parts of questions are clearly labelled.  Answer the questions in the spaces provided – there may be more space than you need.  You should show sufficient working to make your methods clear. Answers without working may not gain full credit.  Inexact answers should be given to three significant figures unless otherwise stated. Information  A booklet ‘Mathematical Formulae and Statistical Tables’ is provided.  There are 11 questions in this paper. The total is 100.  The for each question are shown in brackets – use this as a guide as to how much time to spend on each question. Advice  Read each question carefully before you start to answer it.  Try to answer every question.  Check your answers if you have time at the end.  If you change your mind about an answer, cross it out and put your new answer and any working underneath. 1 SECTION A: STATISTICS Answer ALL questions. 1. The number of bacteria, n thousand per cm3 , in a sample of liquid is measured over a period of time, t, in hours. The data is shown in the table. t 3.9 5.5 6.8 8.5 10.6 11.5 13.3 14.7 16.5 17.8 n 10. 1 13.1 14.6 20.7 27.9 31.5 40 49.9 64.7 75.6 The data is coded using the changes of variable x = t and y = log10 n. The regression line of y on x is found to be y = 0.7606 + 0.0635x. (a) Given that the data can be modelled by an equation of the form n = abt where a and b are constants, find the values of a and b. (3) (b) Give an interpretation of the constant a in this equation. (1) (c) Explain why this model is not reliable for estimating the number of bacteria after 24 hours. (1) (Total 5 marks) _____________________________________________________________________________ 2 2. In a factory, three machinists, Amy, Brad and Ceri, are used to sew shirts. Amy sews 40% of the shirts. Brad sews 35% of the shirts. Ceri sews the rest of the shirts. It is known that 5% of the shirts sewn by Amy are faulty, 2% of the shirts sewn by Brad are faulty and 3% of the shirts sewn by Ceri are faulty. (a) Draw a tree diagram to illustrate all the possible outcomes and associated probabilities. (3) A shirt is selected at random. (b) Calculate the probability that the shirt is sewn by Brad and is not faulty. (2) (c) Calculate the probability that the shirt is faulty. (2) (d) Given that the shirt is faulty, find the probability that it was not sewn by Ceri.
Read More

Preview 1 out of 12 Pages

09a_A_level_Mathematics_Practice_Paper_I___Statistics_and_Mechanics.docx.pdf

Download all 12 pages for $ 7.50

Reviews (0)

$ 7.50


Seller

Joined: 6 months ago

Document sold: 0

Reviews received
1
0
0
0
0

Send Message
Document Information
Buy Document

$7.50