Home Chemistry Questions Only

Quiz 11.1A AP Statistics

Course

Subject
Chemistry

Category
Questions Only

Pages
40

Uploaded By
ATIPROS

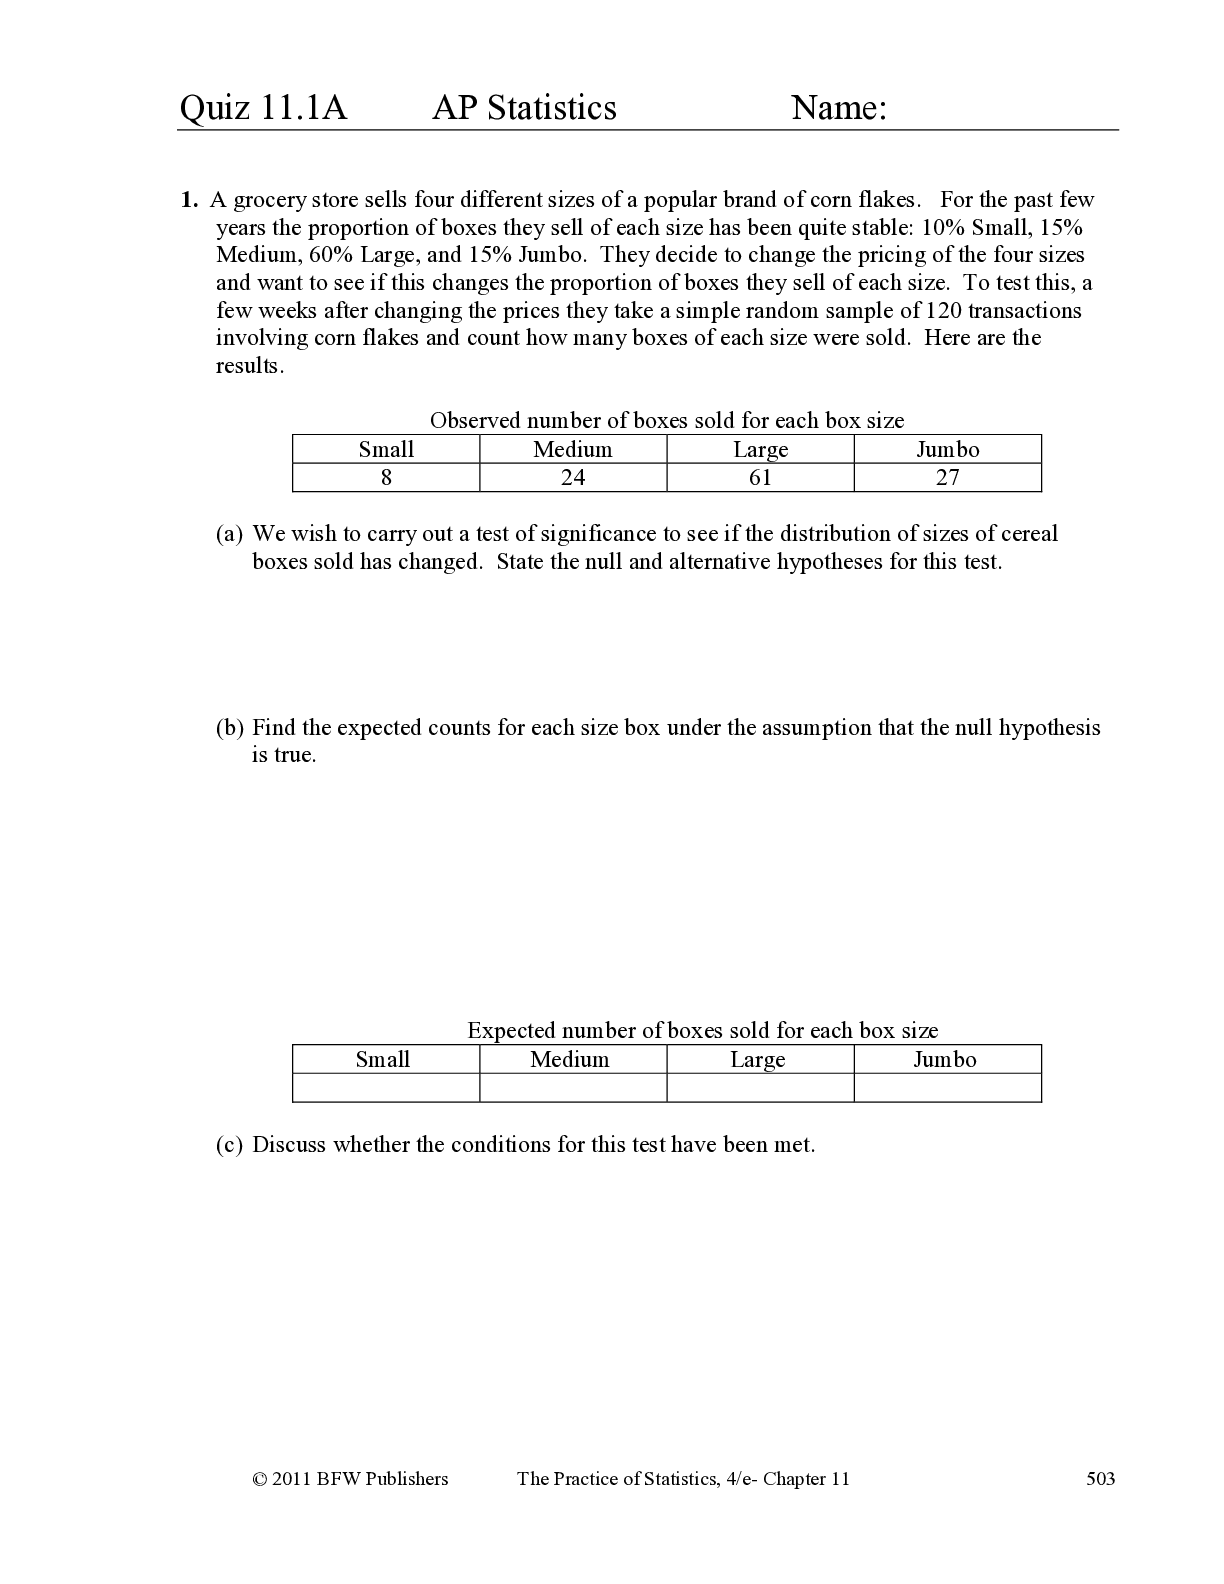
A grocery store sells four different sizes of a popular brand of corn flakes. For the past few years the proportion of boxes they sell of each size has been quite stable: 10% Small, 15% Medium, 60% Large, and 15% Jumbo. They decide to change the pricing of the four sizes and want to see if this changes the proportion of boxes they sell of each size. To test this, a few weeks after changing the prices they take a simple random sample of 120 transactions involving corn flakes and count how many boxes of each size were sold. Here are the results. Observed number of boxes sold for each box size Small Medium Large Jumbo 8 24 61 27 (a) We wish to carry out a test of significance to see if the distribution of sizes of cereal boxes sold has changed. State the null and alternative hypotheses for this test. (b) Find the expected counts for each size box under the assumption that the null hypothesis is true. Expected number of boxes sold for each box size Small Medium Large Jumbo (c) Discuss whether the conditions for this test have been met. 504 The Practice of Statistics, 4/e- Chapter 11 © 2011 BFW Publishers (d) Find the value of the test statistic and the P-value of the test, and make the appropriate conclusion. Use = 0.05. (e)Based on your answer to (d), which error is it possible that you have made, Type I or Type II? Describe that error in the context of the problem. (f) Use the components of the chi-square statistic to perform a follow-up analysis on the impact of the new prices on the sales of different sizes of cereal boxes. © 2011 BFW Publishers The Practice of Statistics, 4/e- Chapter 11 505 Quiz 11.1B AP Statistics Name: 1. In some countries, people believe that blood type has a strong impact on personality. For example, Type B blood is thought to be associated with passion and creativity. A statistics student at a large U.S. university decides to test this theory. Reasoning that people involved in the arts should be passionate and creative, she takes a simple random sample of students majoring or minoring in arts at her university and asks them for their blood type. Here are her results: Assume the distribution of blood type among all U.S. residents is as follows: Type A: 42%; Type B: 10%; Type AB: 4%; Type O: 44%. (a) The student wants to carry out a test of significance to see if the distribution of blood types among arts majors or minors is different from the U.S. distribution. State the null and alternative hypotheses for this test. (b) Find the expected counts for each blood type under the assumption that the null hypothesis is true. (c) Discuss whether the conditions for this test have been met. Observed number of performing arts majors with each blood type Type A Type B Type AB Type 0 Total 50 23 10 67 150 Expected number of performing arts majors with each blood type
Read More

Preview 1 out of 40 Pages

pdf (6).pdf

Download all 40 pages for $ 7.00

Reviews (0)

$ 7.00


Seller

Joined: 6 months ago

Document sold: 0

Reviews received
1
0
0
0
0

Send Message
Document Information
Buy Document

$7.00