For each description below, identify each underlined number as a parameter or statistic. Use
appropriate notation to describe each number, e.g., ˆ 0.96 p .
(a) A 1993 survey conducted by the Richmond Times-Dispatch one week before election day
asked voters which candidate for the state’s attorney general they would vote for. 37% of
the respondents said they would vote for the Democratic candidate. On election day,
41% actually voted for the Democratic candidate.
(b) The National Center for Health Statistics reports that the mean systolic blood pressure for
males 35 to 44 years of age is 128 and the standard deviation is 15. The medical director
of a large company looks at the medical records of 72 executives in this age group and
finds that the mean systolic blood pressure for these executives is 126.07.
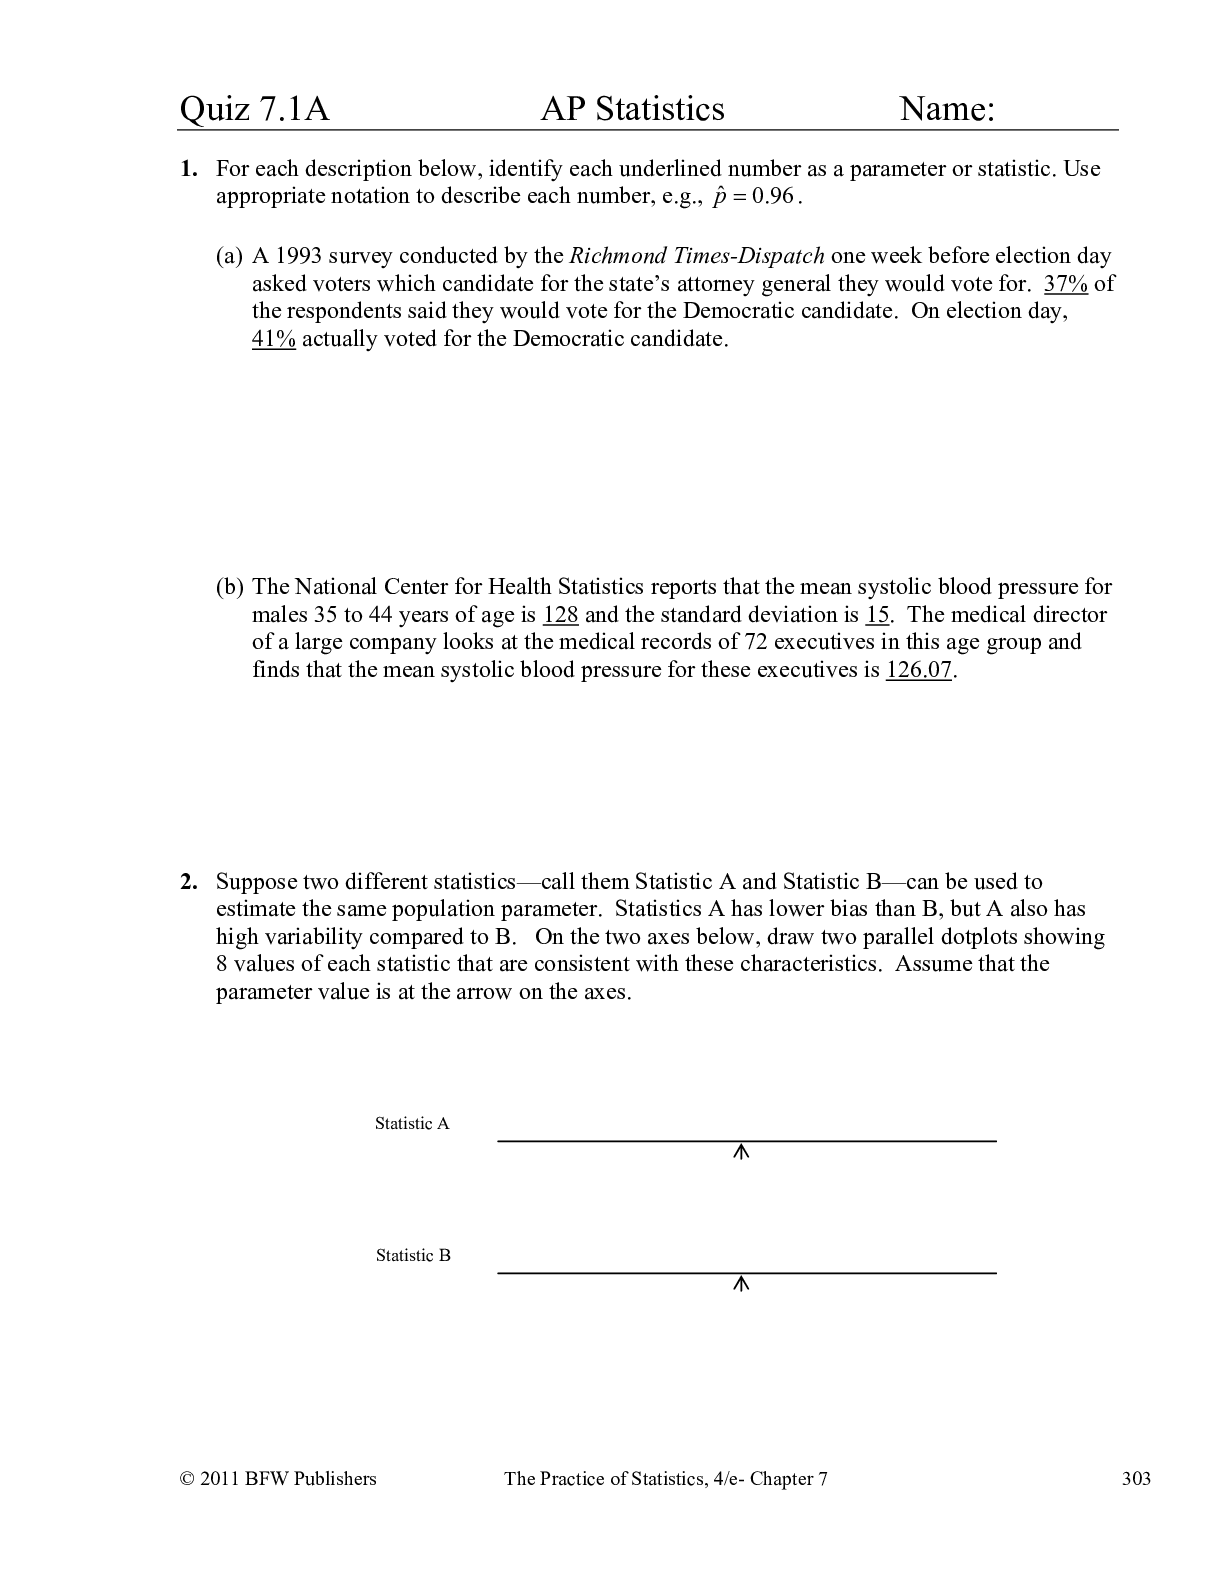
2. Suppose two different statistics—call them Statistic A and Statistic B—can be used to
estimate the same population parameter. Statistics A has lower bias than B, but A also has
high variability compared to B. On the two axes below, draw two parallel dotplots showing
8 values of each statistic that are consistent with these characteristics. Assume that the
parameter value is at the arrow on the axes.
Statistic A
Statistic B
304 The Practice of Statistics, 4/e- Chapter 7 © 2011 BFW Publishers
3. A large pet store that specializes in tropical fish has several thousand guppies. The store
claims that the guppies have a mean length of 5 cm and a standard deviation of 0.5 cm. You
come to the store and buy 10 randomly-selected guppies and find that the mean length of
your 10 guppies is 4.8 cm. This makes you suspect that the mean fish length is not what the
store says it is. To explore this further, you assume that the length of guppies is Normally
distributed and use a computer to simulate 200 samples of 10 guppies from the store’s
claimed population. Below is a dotplot of the means from these 200 samples.
(a) What is the population in this situation, and what population parameters have we been
given?
(b) The distribution of one sample is described in the opening paragraph. What information
have we been given about this sample?
(c) Is the dotplot above a sampling distribution? Explain.
(d) Do you think the store is being honest about the length of its guppies? Justify your
answer.
© 2011 BFW Publishers The Practice of Statistics, 4/e- Chapter 7 305
Quiz 7.1B AP Statistics Name:
1. For each description below, identify each underlined number as a parameter or statistic. Use
appropriate notation to describe each number, e.g., ˆ 0.96 p .
(a) Nationwide, 84% of people are living in the same house they were living in one year ago.
The town council of Pleasant Valley surveys 100 residents and find that 75% of them
have not moved in the past year.
(b) The mean birthweight of infants in the United States in 2006 was 3.3 kg with a standard
deviation of 0.57 kg. An obstetrician determines that among her own patients, the mean
birthweight is 3.6 kg.
2. Suppose two different statistics—call them Statistic A and Statistic B—can be used to
estimate the same population parameter. Statistic A has lower bias than B, and A also has
low variability compared to B. On the two axes below, draw two parallel dotplots showing
8 values of each statistic that are consistent with these characteristics. Assume that the
parameter value is at the arrow on the axes.
Statistic A
Statistic B
306 The Practice of Statistics, 4/e- Chapter 7 © 2011 BFW Publishers
3. Inexpensive bathroom scales are not consistently accurate. A manufacturer of bathroom
scales says that when a 150 pound weight is placed on all the scales produced in his factory,
the weight indicated by the scales is Normally distributed with a mean of 150 pounds and a
standard deviation of 2 pounds. A consumer advocacy group acquires a randomly-selected
group of 12 scales from the manufacturer and weighs a 150 weight on each one. They get a
mean weight of 151 pounds, which makes them suspicious about the company’s claim. To
test this, they use a computer to simulate 200 samples of 12 scales from a population with a
mean of 150 pounds and standard deviation 2 pounds. Below is a dotplot of the means from
these 200 samples.
(a) What is the population in this situation, and what population parameters have we been
given?
(b) The distribution of one sample is described in the opening paragraph. What information
have we been given about this sample?
(c) Is the dotplot above a sampling distribution? Explain.
(d) Do you think the manufacturer is being honest about the accuracy of its bathroom scales?
Justify your answer.
Read More
.png)

