Home Chemistry Questions and Answers

Quiz with answers 4/1&2016 Week 7 QLU (Week 7)

Course
Sociology

Subject
Chemistry

Category
Questions and Answers

Pages
20

Uploaded By
ATIPROS

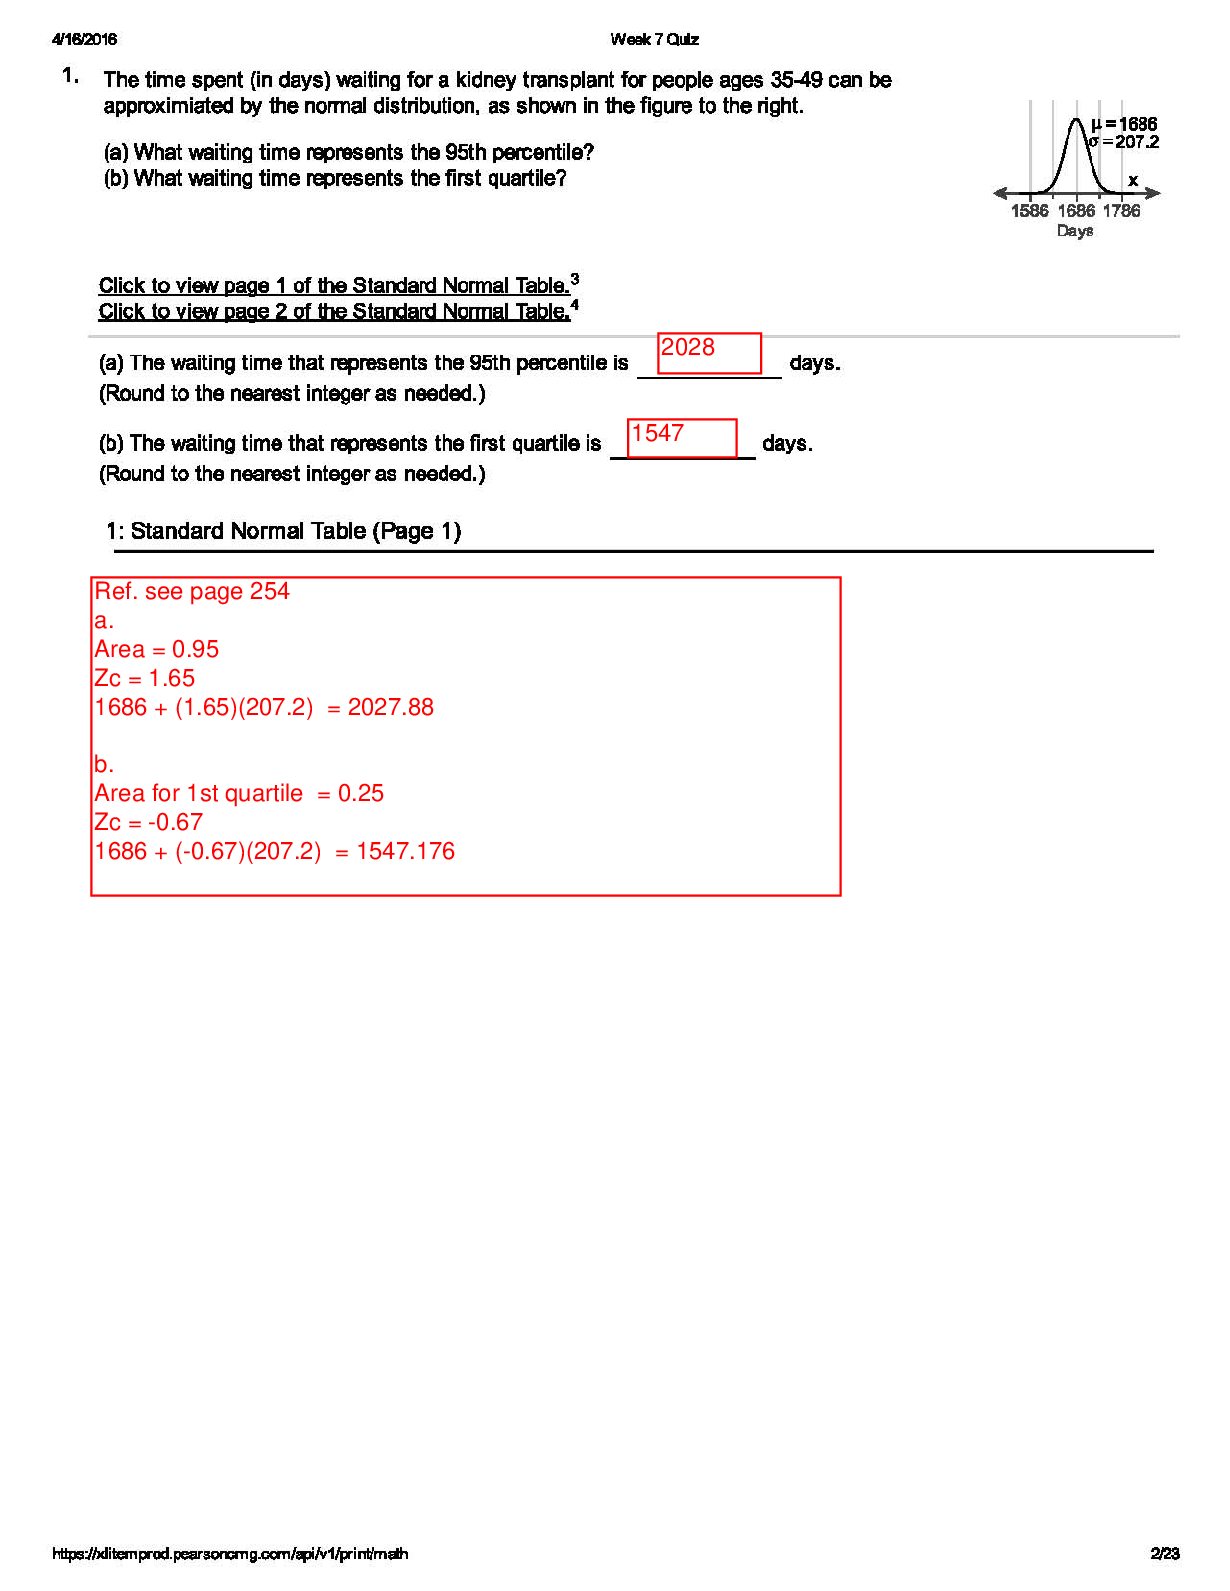
The time spent (in days) waiting for a kidney transplant tor people ages 35-49 can be approximiated by the normal distribution, as shown in the figure to the right. (a) What waiting time represents the 95th percentile? (b) What waiting time represents the first quartile? 3 Click to viewpage 1 of the Standard Normal Table.Click to viewpage 2 of the Standard Normal Table,4 2028 (a) The waiting timethat represents the 95th percentile is (Round to tha nearest intagar as needad.) 1547 (b) The waiting timethat represents the first quartile is (Round to tha nearest intagar as needad.) 1: Standard Normal Table (Page 1) Ref. see page 254 a. Area = 0.95 Zc = 1.65 1686 + (1.65)(207.2) = 2027.88 b. Area for 1st quartile = 0.25 Zc = -0.67 1686 + (-0.67)(207.2) = 1547.176
Read More

Preview 5 out of 20 Pages

Week_7_Quiz_with_answers.pdf.pdf prev1731008800672d192061c37.png

Download all 20 pages for $ 10.00

Reviews (0)

$ 10.00


Seller

Joined: 7 months ago

Document sold: 0

Reviews received
1
0
0
0
0

Send Message
Document Information
Buy Document

$10.00