Statistics > Questions and Answers > Sophia Statistics FINAL Milestone. With RATIONALE and CONCEPT. Score 21/25 (For revision)

Sophia Statistics FINAL Milestone. With RATIONALE and CONCEPT. Score 21/25 (For revision)

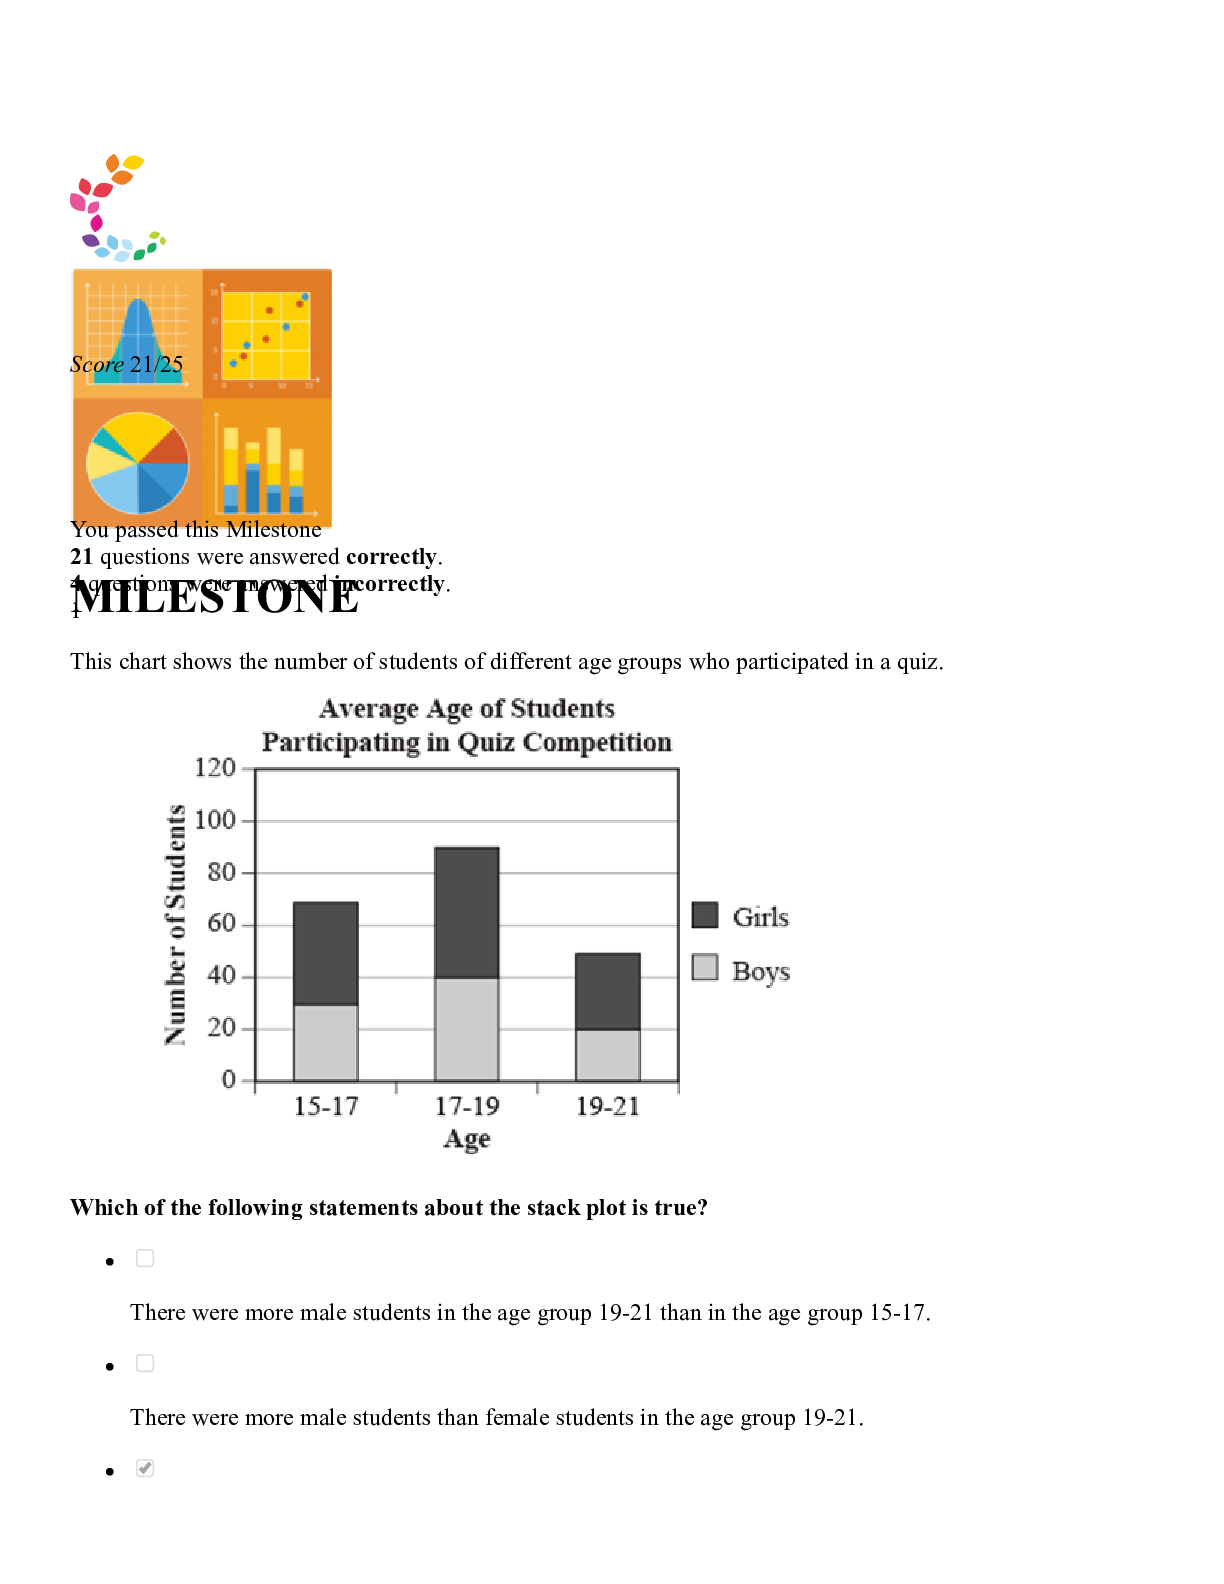
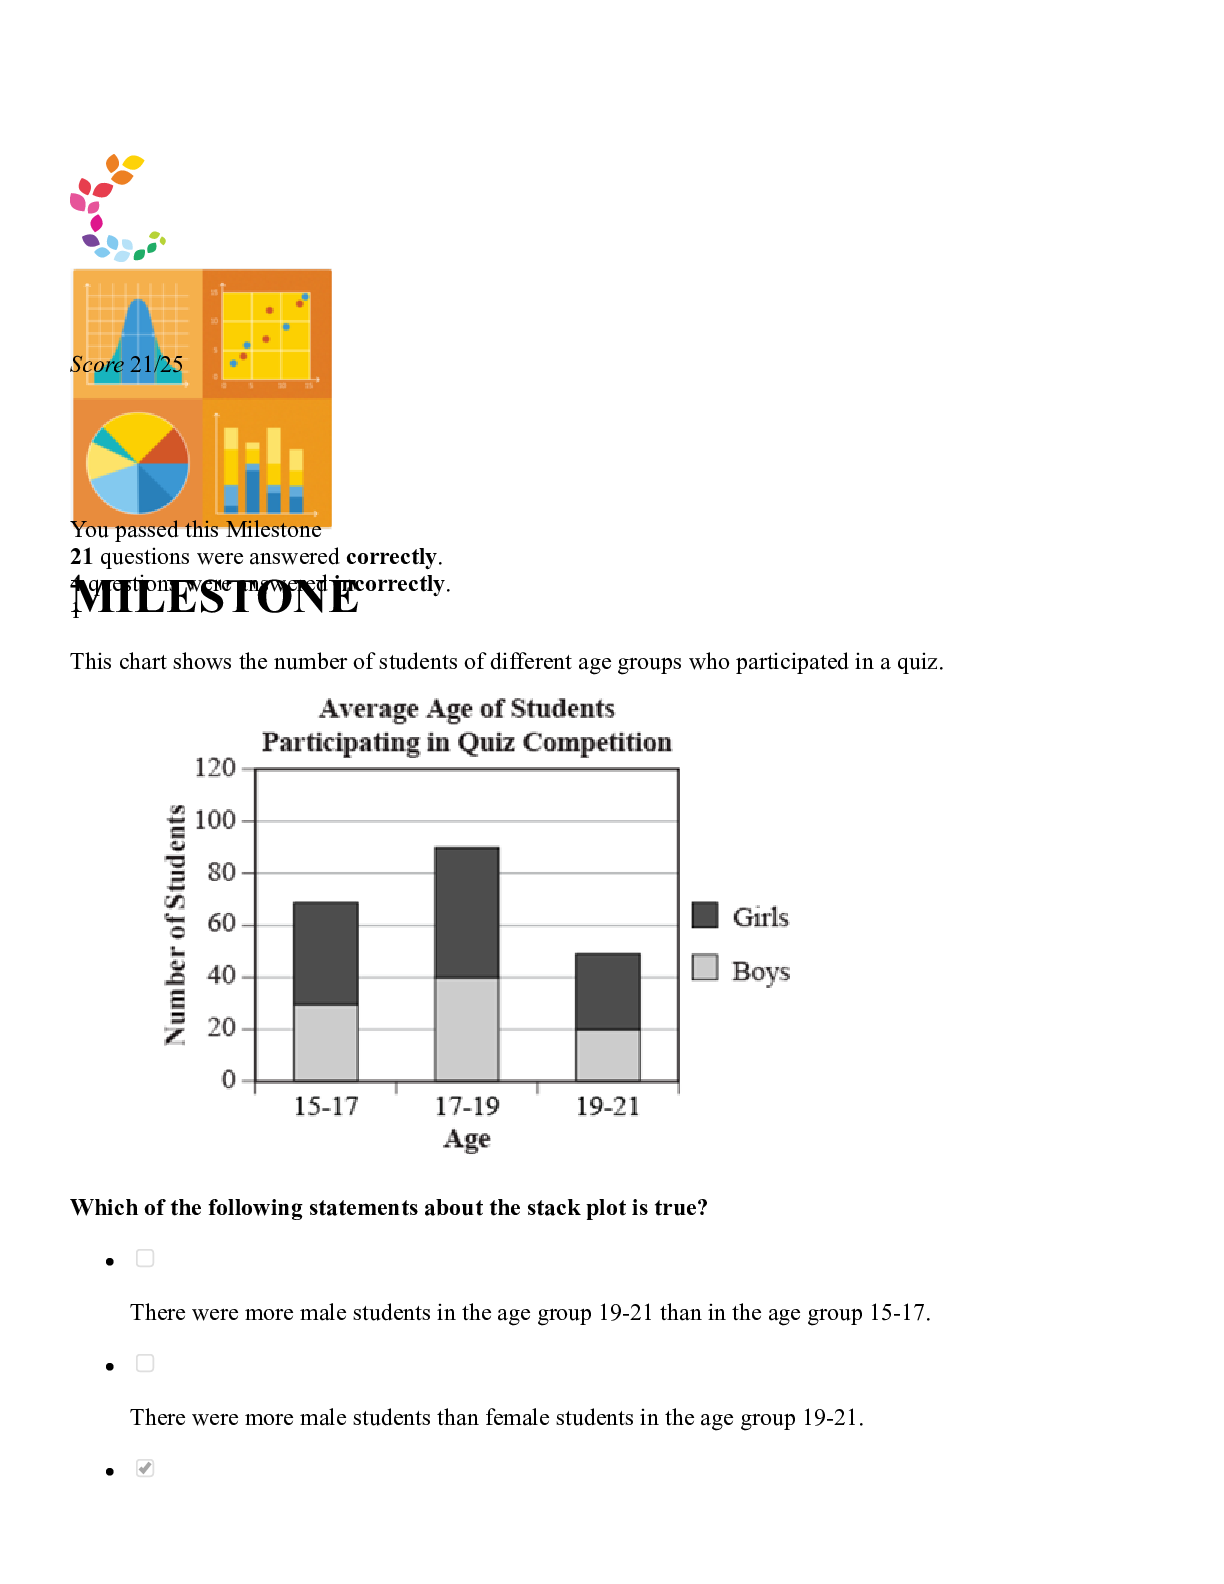
21 questions were answered correctly. 4 questions were answered incorrectly. MILESTONE 1 This chart shows the number of students of different age groups who participated in a quiz. Which of the following statements about the stack plot is true? There were more male students in the age group 19 ... -21 than in the age group 15-17. There were more male students than female students in the age group 19-21. There were more female students in the age group 17-19 than in any other age group. There were more students in the age group 15-17 than in any other age group. RATIONALE If we note that the greatest area for the girls is the longest darker region, this occurs in the age group 17-19. CONCEPT Stack Plots I need help with this question 2 Jay wants to study nutrition and performance in schools using available data. Which of the scenarios below will provide Jay with available data? Going to a local high school and asking the principal for information about students' previous grades, then interviewing a random selection of students about their eating habits. Going to a local high school and asking the principal for information about students' current and previous grades, then interviewing a random selection of students about their eating habits. Going to a local high school and asking the principal for information about students' current and previous grades, then asking the health teacher for the results from a survey students took in health class. Going to a local college and asking current undergraduates to report their grades and eating habits from high school. RATIONALE Recall, for data to be considered available data it must already be collected. Since the grades data and survey data were already collected these are examples of available data. CONCEPT Data I need help with this question 3 Regan wants to study how reading on a computer affects comprehension among elementary school students. Regan thinks that girls and boys might differ and he also suspects that grade level will affect the results. He decides to create a male and a female group for each grade. Within each group, he randomly assigns half of the students to read an article on paper and half of the students to read the article on a computer. Which type of experimental design does this situation illustrate? Completely Randomized Randomized Block Double-Blind Matched-Pair RATIONALE Since students are put into gender and grade blocks and are then assigned treatment or control randomly this is called a randomized block design. CONCEPT Randomized Block Design I need help with this question 4 Select the correct statement regarding experiments. A researcher can control the environment and observe the response. A researcher cannot control the environment but can observe the response. A researcher can control the environment but cannot observe the response. A researcher can neither control the environment nor observe the response. RATIONALE The defining part of experimental setting is that the researcher can control the setting and apply some treatment to observe how it affects an outcome of interest. CONCEPT Observational Studies and Experiments I need help with this question 5 Rachel measured the lengths of a random sample of 100 screws. The mean length was 2.9 inches, and the population standard deviation is 0.1 inch. To see if the batch of screws has a significantly different mean length from 3 inches, what would the value of the z-test statistic be? 1 10 -10 -1 RATIONALE If we first note the denominator of Then, getting the z-score we can note it is This tells us that 2.9 is 10 standard deviations below the value of 3, which is extremely far away. CONCEPT Z-Test for Population Means I need help with this question 6 Jesse takes two data points from the weight and feed cost data set to calculate a slope, or average rate of change. A ferret weighs 2.1 pounds and costs $3.40 per week to feed, while a Labrador Retriever weighs 70 pounds and costs $7.50 per week to feed. [Show More]

Preview: 6 out of 21 pages
loader

Generating document previews ...

Purchase the document to get the full access instantly

Trusted by 100,000+ Students
100% Money Back Guarantee
Immediately available after payment
Document Details

Price:

$6.63


Pages:

21 pages

Rating:


Add to cart
573
0
Published By

master papers profile

master papers
Joined: 3 years ago
Papers sold: 269


Send message
Written for

Category:

Questions and Answers

Course:

Statistics

Last updated at :

1 year ago

Language
English

0 Reviews

What people say about us