Home Chemistry Questions and Answers

STAT 200 Week 2 Homework Problems

Course

Subject
Chemistry

Category
Questions and Answers

Pages
8

Uploaded By
ATIPROS

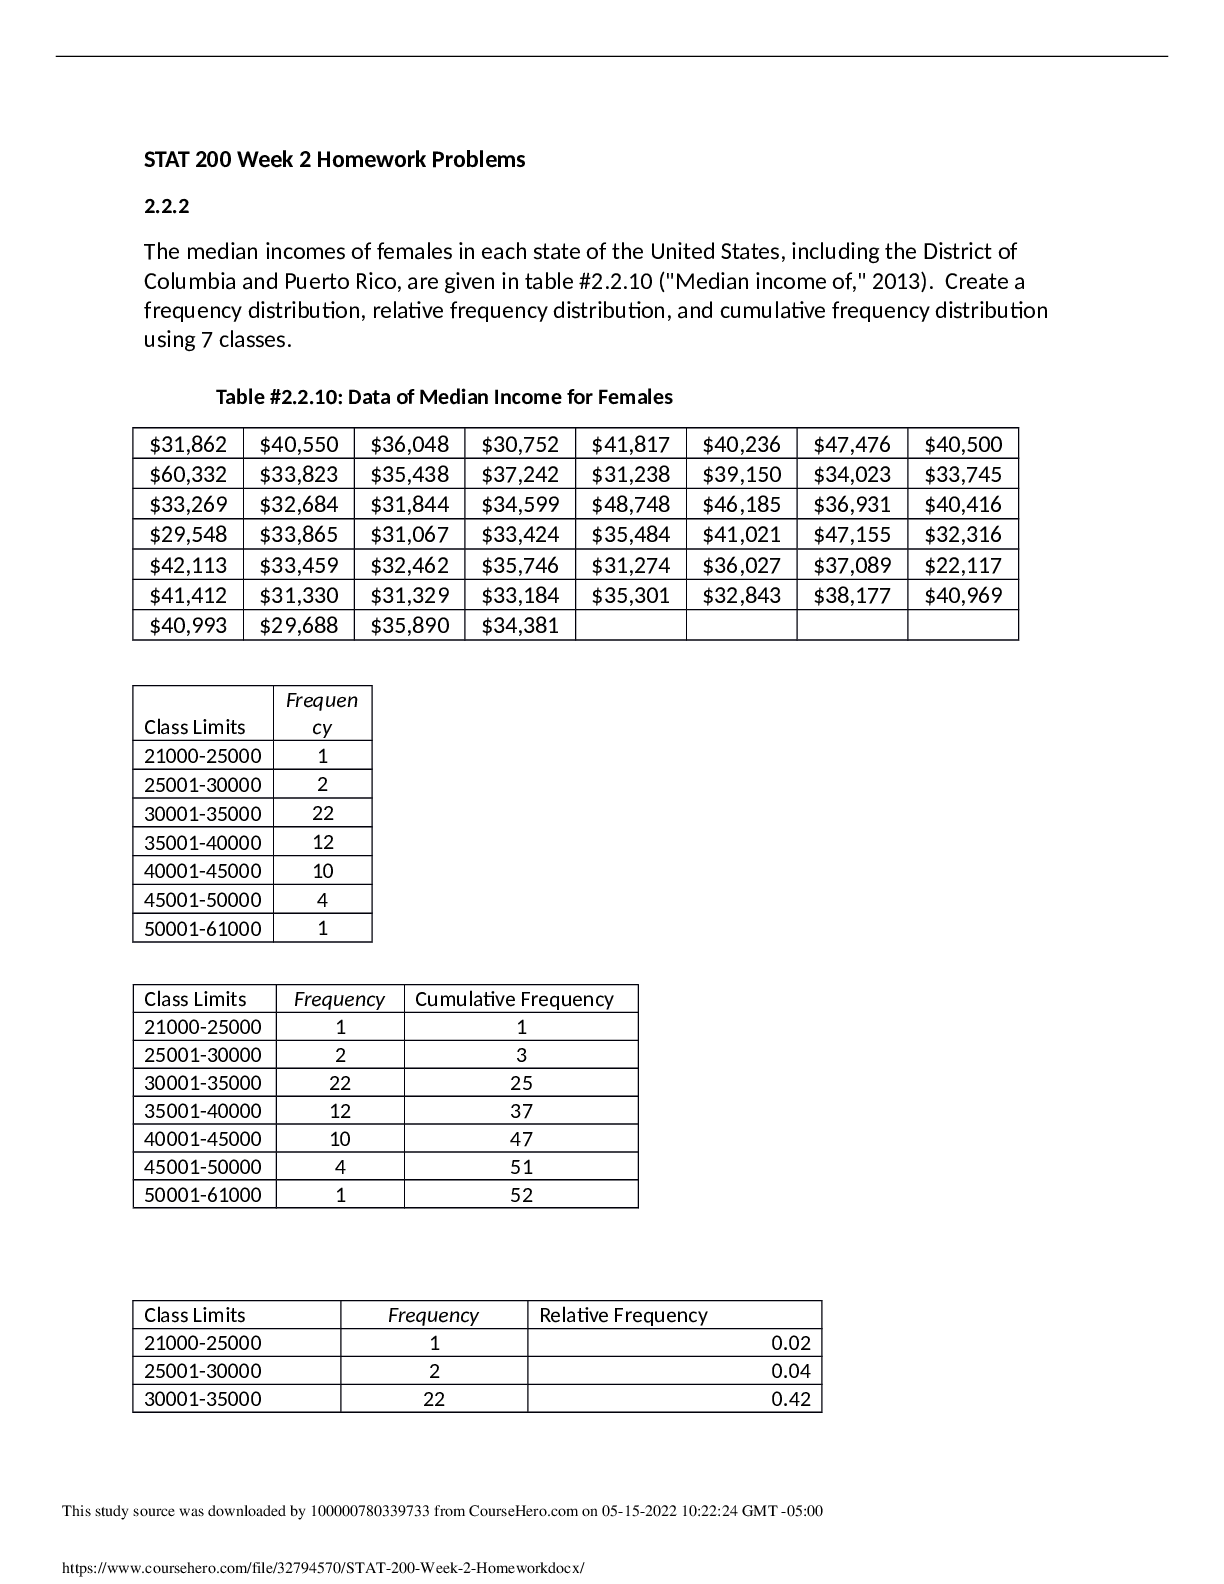
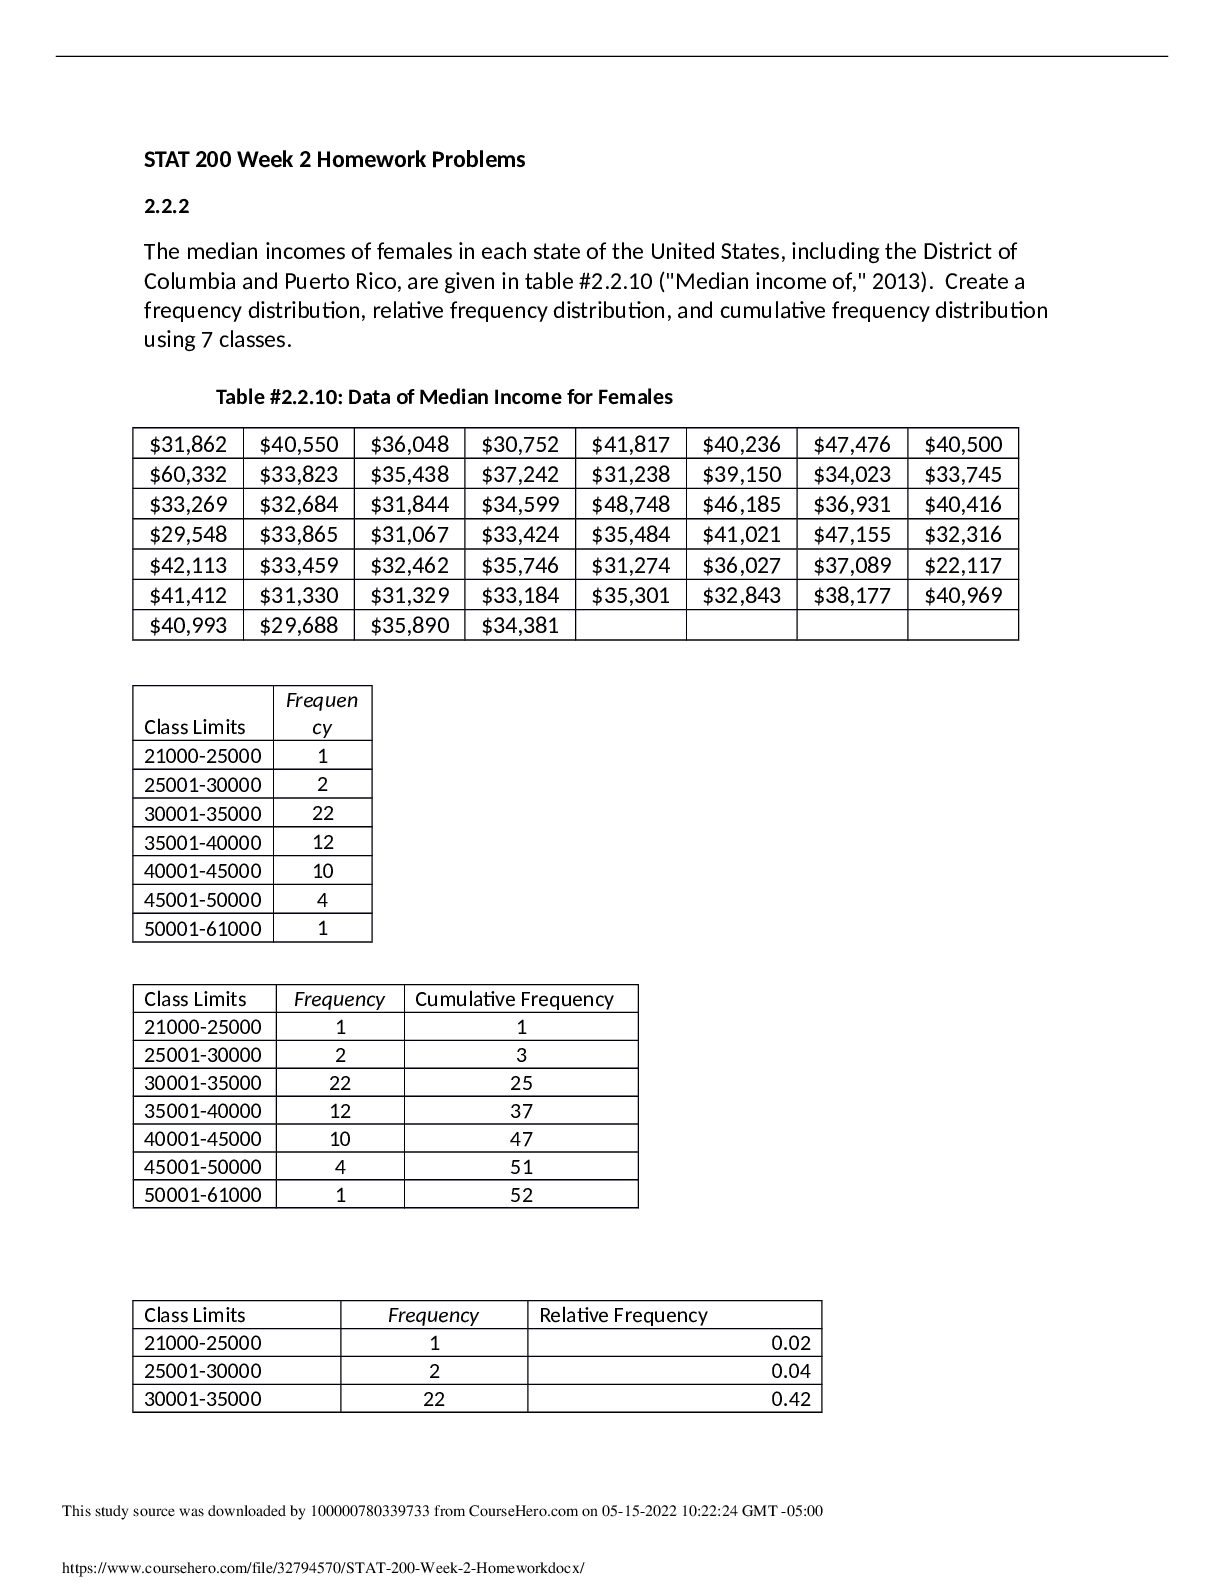
2.2.2 The median incomes of females in each state of the United States, including the District of Columbia and Puerto Rico, are given in table #2.2.10 ("Median income of," 2013). Create a frequency distribution, relative frequency distribution, and cumulative frequency distribution using 7 classes. Table #2.2.10: Data of Median Income for Females $31,862 $40,550 $36,048 $30,752 $41,817 $40,236 $47,476 $40,500 $60,332 $33,823 $35,438 $37,242 $31,238 $39,150 $34,023 $33,745 $33,269 $32,684 $31,844 $34,599 $48,748 $46,185 $36,931 $40,416 $29,548 $33,865 $31,067 $33,424 $35,484 $41,021 $47,155 $32,316 $42,113 $33,459 $32,462 $35,746 $31,274 $36,027 $37,089 $22,117 $41,412 $31,330 $31,329 $33,184 $35,301 $32,843 $38,177 $40,969 $40,993 $29,688 $35,890 $34,381 Class Limits 21000-25000 25001-30000 30001-35000 35001-40000 40001-45000 45001-50000 50001-61000 Frequen cy 1 2 22 12 10 4 1 Class Limits Frequency Cumulative Frequency 21000-25000 1 1 25001-30000 2 3 30001-35000 22 25 35001-40000 12 37 40001-45000 10 47 45001-50000 4 51 50001-61000 1 52 Class Limits Frequency Relative Frequency 21000-25000 1 0.02 25001-30000 2 0.04 30001-35000 22 0.42 This study source was downloaded by 100000780339733 from CourseHero.com on 05-15-2022 10:22:24 GMT -05:00 https://www.coursehero.com/file/32794570/STAT-200-Week-2-Homeworkdocx/ 35001-40000 12 0.23 40001-45000 10 0.19 45001-50000 4 0.08 50001-61000 1 0.02 Total 52 1.00 2.2.6 Create a histogram and relative frequency histogram for the data in table #2.2.10. Describe the shape and any findings you can from the graph. Skewed to the right.
Read More

Preview 2 out of 8 Pages

STAT_200_Week_2_Homework.docx.pdf prev1731000381672cf83da24dc.png

Download all 8 pages for $ 6.50

Reviews (0)

$ 6.50


Seller

Joined: 8 months ago

Document sold: 0

Reviews received
1
0
0
0
0

Send Message
Document Information
Buy Document

$6.50